
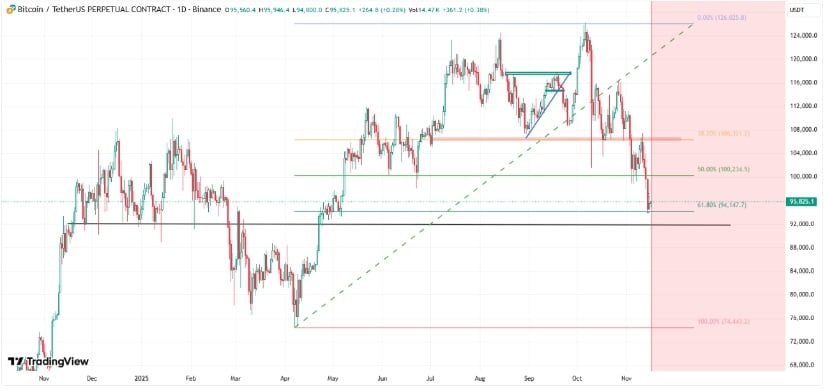
- Bitcoin is sitting at the 61% Fibonacci “golden level,” a zone traders watch closely for possible reversal setups after deep pullbacks.
- Despite a small bullish candle, BTC still holds a bearish structure, with possible dips toward $88K–$84K or even $77K–$74.5K if selling continues.
- ETF outflows and profit-taking add pressure, but shrinking exchange reserves hint that a recovery bounce is still possible if momentum shifts.
Bitcoin is brushing up against one of those levels traders obsess over—the 61% Fibonacci retracement, the so-called golden level that tends to spark reactions whether the market’s feeling brave or scared. After a pretty shaky couple of weeks filled with sharp dips, ETF outflows, and tons of volatility, BTC just printed a bullish daily candle right at that golden zone… which has people wondering if momentum might be trying to flip, even if only for a breather.
BTC Market Overview: Wild Swings, Big Volume
BTC spent most of the day bouncing between $94K and $97.5K, kind of jittery and unsure of what mood it wants to be in. It’s down nearly 7% on the week and about 14% on the monthly chart, so momentum definitely hasn’t been pretty. But that latest green candle—small as it was—did catch trader attention because bounces off deep retracements aren’t uncommon after these steep pullbacks.
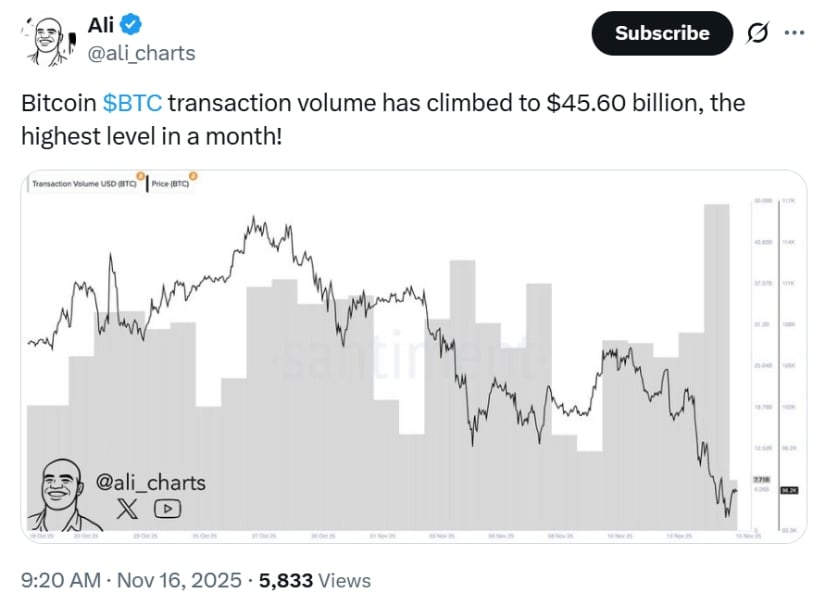
On-chain activity got weirdly busy too. IntoTheBlock data shows Bitcoin’s transaction volume hit $45.6 billion on Nov. 15, the highest in a month. More than 516,000 BTC moved during that window, which signals… well, something big—just not necessarily bullish. Analyst Ali Martinez noted the spikes have lately lined up with price declines and ETF outflows, meaning it looks like profit-taking rather than accumulation. Still, volume is volume, and markets usually wake up around it.
The 61% Fibonacci Zone: A Reaction Point, Not a Magic Wand
Fibonacci retracements are one of those tools traders love because markets seem to respect them in strange, almost poetic ways. The golden level at 61.8% marks the point where a majority of the previous rally has been erased, and buyers often show up here sniffing for value.
Technical strategist Ted says this zone acts more like a psychological decision point: you’ll see buyers defend it to test the waters, while short-term traders bail out to lock in whatever profits they still have. Essentially, it’s a pressure point—markets rarely pass through it quietly.
Right now BTC is sitting right in that pocket, and yesterday’s bullish candle hints at the possibility of a continuation move… though nothing guaranteed. This is more of a “watch closely” area than a “back up the truck” moment.
Technical Structure Still Bearish, With Bounce Potential
Zooming into the daily chart, Bitcoin is still in a bearish structure. It printed a lower low, and the break of structure under $98K confirmed fading bullish strength. Trendlines have snapped too, which usually signals the uptrend’s legs are getting tired.
Based on liquidity mapping, BTC could drift toward deeper zones like $88K–$84K if sellers stay aggressive. In a more aggressive flush scenario, the chart even points toward the $77K–$74.5K region where historical liquidity clusters sit. These aren’t predictions—just zones traders watch because liquidity tends to pull price around like gravity.
But, flip side? A retest of old trendlines could push BTC back toward $98K–$100K if momentum firms up a bit. Analysts say the probability for that is moderate but not yet convincing because volume patterns still lean defensive.
Sentiment Split as ETF Outflows Add Pressure
Institutional flows haven’t been friendly this week. U.S. spot Bitcoin ETFs logged more than $1B in outflows, with BlackRock alone seeing $532M pulled. Ted and others note that these outflows can contribute to selling pressure, especially when combined with heavy transaction spikes.
At the same time, exchange reserves keep shrinking to multi-month lows—meaning fewer coins are sitting on exchanges ready to be sold. Long-term holders are tightening supply, which is usually a good sign for the macro picture, even if the short-term feels rough.
Short-Term Bitcoin Predictions: Bounce or Breakdown?
Some traders think Bitcoin might have found a temporary floor around $94K, especially with the golden ratio lining up right here. Others believe the structural breakdown hints at more pain before relief, potentially toward $74K if volatility kicks up again.
Analyst Maxwell Mutuma points to CME gaps near $92K and lingering Wyckoff distribution signs—both of which suggest the market might want one more sweep down before a real reversal can stick.