
- Bitcoin charts show strong breakout patterns, with targets between $100,600 and $102,000 by May.
- Short liquidations cluster near $100K, acting as a magnet that could speed up the rally.
- 87% of Bitcoin supply is now in profit, pushing market sentiment closer to a potential euphoric phase.
Bitcoin’s daily chart just confirmed a textbook double bottom formation, smashing through the neckline resistance at around $87,643.
The technical target? Somewhere around $100,575, maybe even a bit higher if momentum really kicks in.
Momentum indicators, like the RSI, still sit deep in bullish territory — and crucially, there’s still plenty of room for further expansion.
Meanwhile, both the 50-day and 200-day EMAs have flipped into solid support zones, giving BTC even more fuel for a continued move up.
Steady post-breakout volume tells a simple story: buyers are still in the driver’s seat.
Put it all together? Bitcoin’s setup is screaming for a push toward $100,600.
Bull Pennant in Play: Eyes on $100,900
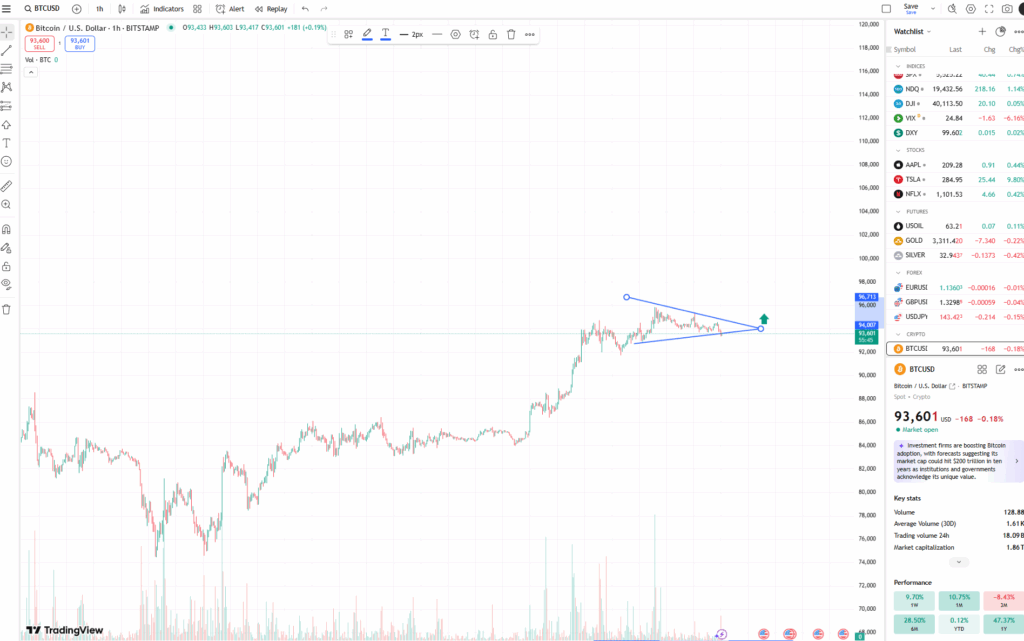
Zooming into the hourly timeframe, BTC is consolidating within a classic bull pennant pattern — usually a pause before the next big move.
Despite a slight dip in volume (which honestly, isn’t unusual here), the structure remains intact.
The target for the next breakout? Around $100,900 if the pennant plays out cleanly.
A breakout above the upper trendline could trigger a wave of buy-side pressure, especially from short-term traders and bots sniffing for psychological round numbers.
Falling Wedge Breakout Hints at $102,000
On the three-day chart, Bitcoin recently burst out of a falling wedge — one of the most reliable bullish reversal patterns out there.
After punching through heavy resistance near $94,000, the projected target for this move lands around $102,270.
Volume spiked during the breakout too, giving even more confirmation that buyers are back in control.
As long as BTC stays above that crucial $94,000–$95,000 area, the path to $100K and beyond looks wide open.
Liquidity Map: $100K Is the Magnet
If you check Binance’s liquidation heatmaps (via CoinGlass), it’s easy to spot it — a massive wall of short liquidations stacking up around $100,000.
In crypto, liquidity often acts like gravity.
As Bitcoin creeps higher, shorts get squeezed out, triggering automatic buy orders that can rapidly accelerate price action.
In short: if BTC keeps pushing, $100K could happen faster than most people expect.
Bitcoin Profitability: Building the Euphoria?
As of April 23, about 87.3% of all Bitcoin in circulation was in profit — a big jump from 82.7% back when BTC was flirting with $94,000 a few weeks ago (Glassnode data).
When over 90% of coins sit in profit for too long, historically, the market tends to tilt into euphoria — often the final leg of a bull cycle.
Right now?
Bitcoin’s profitability ratio is getting dangerously close to that point… and bullish sentiment is heating up fast.