- Chainlink’s price hit a yearly low of $11.87 but remains at a critical 644-day support level, making this a key moment for traders.
- Despite a whale selling 356,665 LINK for $4.59 million, the token gained 2%, showing resilience amid broader market recovery.
- Technical indicators are mixed, with bearish signals on the weekly chart but potential bullish divergences on the daily, suggesting a possible rebound.
Chainlink’s price has been struggling, slipping downward ever since it peaked at $30.95 in December 2024. It just tapped a yearly low of $11.87 on March 11, a level not seen in months. But now, it sits right on a crucial support trend line—one that’s been holding firm for 644 days since June 2023. Traders are watching closely.
A Whale’s Big Exit – But LINK Stays Strong
Just when things seemed shaky, on-chain data revealed an interesting move. A major holder, tied to the wallet ‘0xc6f7f’, sold off 356,665 LINK on March 13. That’s $4.59 million swapped into USDC, with an average exit price of $12.88.
Typically, such a large dump would rattle the market. But surprisingly? LINK didn’t collapse. Instead, it gained 2% in the following 24 hours, closing at $13.15 and bouncing between $12.82 and $13.77. Some credit the resilience to broader market optimism after U.S. inflation data hinted at cooling prices.
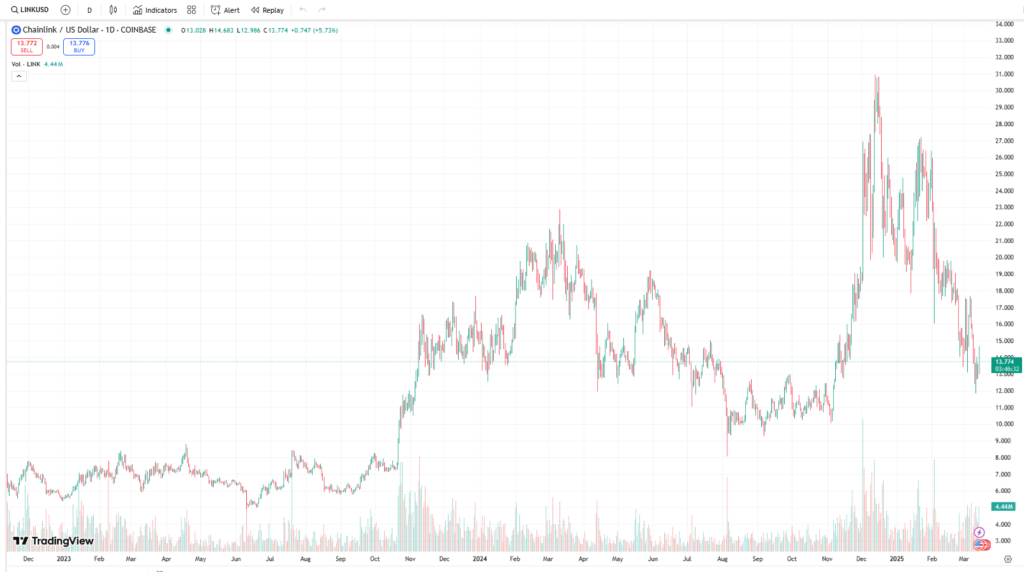
Technical Breakdown – Bearish or Bullish?
From a weekly perspective, things look dicey. LINK failed to hold above $22.50 after a breakout attempt late last year. That false breakout? Often a bad sign.
Indicators aren’t offering much relief either:
- RSI has dipped below 50, a sign of weakness.
- MACD flashed a bearish cross, signaling downward momentum.
- Wave analysis suggests an A-B-C corrective pattern, meaning the last rally may have just been a temporary move in an ongoing downtrend.
Hope on the Horizon? Daily Charts Say Maybe
But it’s not all doom and gloom. The daily chart presents a different picture—LINK’s drop has formed a descending parallel channel, which often resolves with an upside breakout.
And there are bullish divergences appearing:
- Daily RSI and MACD are showing signs of life, forming higher lows even as prices dips.
- These signals usually precede reversals, hinting that LINK could be gearing up for a comeback.
If a bounce happens, first target? $16.30, the channel’s midline. Next? $20.50, the channel’s upper boundary.
What Analysts Are Saying
Not everyone is bearish. Some argue the whale sale isn’t necessarily bad news—the seller still holds 7,693 LINK, suggesting they haven’t completely bailed.
Popular analyst “Bitcoin Buddha” sees potential:
“LINK seems to be recovering after testing support near $12. If this holds, we could be looking at fresh all-time highs.”
Others note a bullish engulfing pattern on the weekly charts—this formation usually signals strong buying pressure.
Fundamentals Still in Play
Beyond price action, Chainlink is staying in the spotlight.
- CEO Sergey Nazarov was a featured speaker at the first-ever White House crypto summit—a massive platform to discuss stablecoins and DeFi regulation.
- He followed it up with a keynote at the Ondo Finance Summit on March 10.
With mainstream visibility like this, market sentiment could shift in LINK’s favor.
Final Word: Make-or-Break Moment
The 644-day support trend line is the key level to watch. If it holds, LINK could ignite a rally. If it breaks? The next stop could be $10 or even $6-9 territory.
This is the moment. Will bulls step in? Or are deeper declines on the way? The next few days could decide it all.