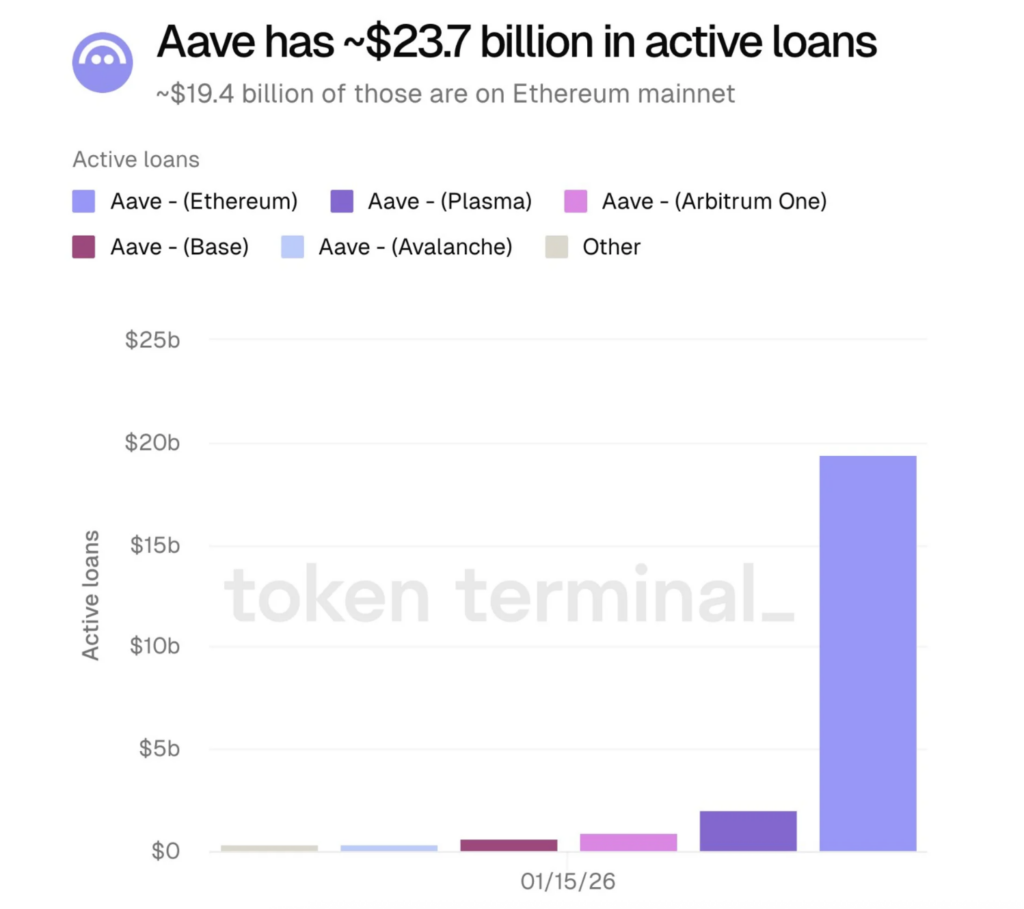
- Aave now holds about $23.7B in active loans, with most activity concentrated on Ethereum
- AAVE has broken out of a descending triangle, flipping key resistance into support
- Weekly indicators show consolidation within a broader bullish trend, not a reversal
Aave has quietly reached another major milestone. The platform now holds roughly $23.7 billion in active loans, a figure that says a lot about how far it’s come. More importantly, it reflects the level of trust users continue to place in Aave, which has steadily grown into one of the most dominant names in decentralized finance.
What stands out is where most of that activity lives. Around $19.4 billion of Aave’s lending volume sits on the Ethereum mainnet. Ethereum’s robust smart contract infrastructure remains a key reason Aave operates so smoothly at scale. It acts as a kind of stability anchor, offering deep liquidity, strong security assumptions, and a user base that’s already comfortable with lending and borrowing. Despite all the talk around new chains, Ethereum still does much of the heavy lifting for DeFi.
AAVE Breaks Structure and Flips the Bias
While the fundamentals have been strong, the technical picture is starting to catch up. Crypto analyst Whales_Crypto_Trading recently pointed out that AAVE had been trading inside a descending triangle, printing lower highs while leaning against a firm support zone between $131 and $136.
That pattern has now broken. After a prolonged consolidation, price pushed decisively higher, invalidating the bearish setup. The breakout came with improving momentum and a reclaim of the 50-day moving average, a level many traders watch closely. That shift alone changes the tone of the chart.
The next resistance zone sits around $167 to $170, followed by a heavier supply area between $174 and $182. Clearing that upper band would open the door to further upside. On the downside, prior resistance around $150 to $155, along with the MA50, has now flipped into support, at least for the moment.
Using the measured move from the broken triangle, upside targets begin to stretch toward $200, with a broader objective in the $210 to $220 range. Interestingly, volume above resistance remains relatively light. That can sometimes allow price to move faster once acceptance is established. As long as AAVE holds above $150 to $155, the bullish structure stays intact, with $182, $200, and $220 remaining the key levels to watch.
Weekly Indicators Suggest a Pause, Not a Reversal
Zooming out to the weekly timeframe, the broader trend still leans positive. The MACD remains above zero, which typically signals an uptrend. That said, the MACD line has dipped slightly below the signal line, and the histogram has turned mildly red. Momentum is cooling, not collapsing.
RSI sits near 54, comfortably above the 50 level that usually separates bullish and bearish regimes. There are no signs of overbought conditions here. Instead, momentum appears to be resetting from a lower base, often a sign of consolidation within an existing uptrend.
Taken together, the weekly indicators suggest AAVE may be taking a breather rather than rolling over. If momentum starts to rebuild, the larger uptrend could easily resume. For now, patience seems more appropriate than chasing, as structure and fundamentals continue to do most of the work behind the scenes.