

- Ethereum has triggered a new TD Sequential buy signal as analysts watch the critical $1,750 support level.
- Technical indicators, including the MACD and Bollinger Bands, continue to suggest bullish momentum is building.
- Holding above key support could open the door to a rally toward the $1,800-$1,826 resistance zone.
Ethereum is showing early signs of strength again after defending an important support level, and some analysts believe the recent pullback may simply be a pause before another move higher.
Although ETH slipped slightly over the past 24 hours, its broader recovery remains intact from a technical standpoint. Several widely followed indicators continue pointing toward improving momentum, with traders now focused on one level that could determine what happens next.
At the time of writing, Ethereum is trading near $1,747 with a daily trading volume of roughly $12.46 billion and a market capitalization of approximately $211 billion.
TD Sequential Flashes a New Buy Signal
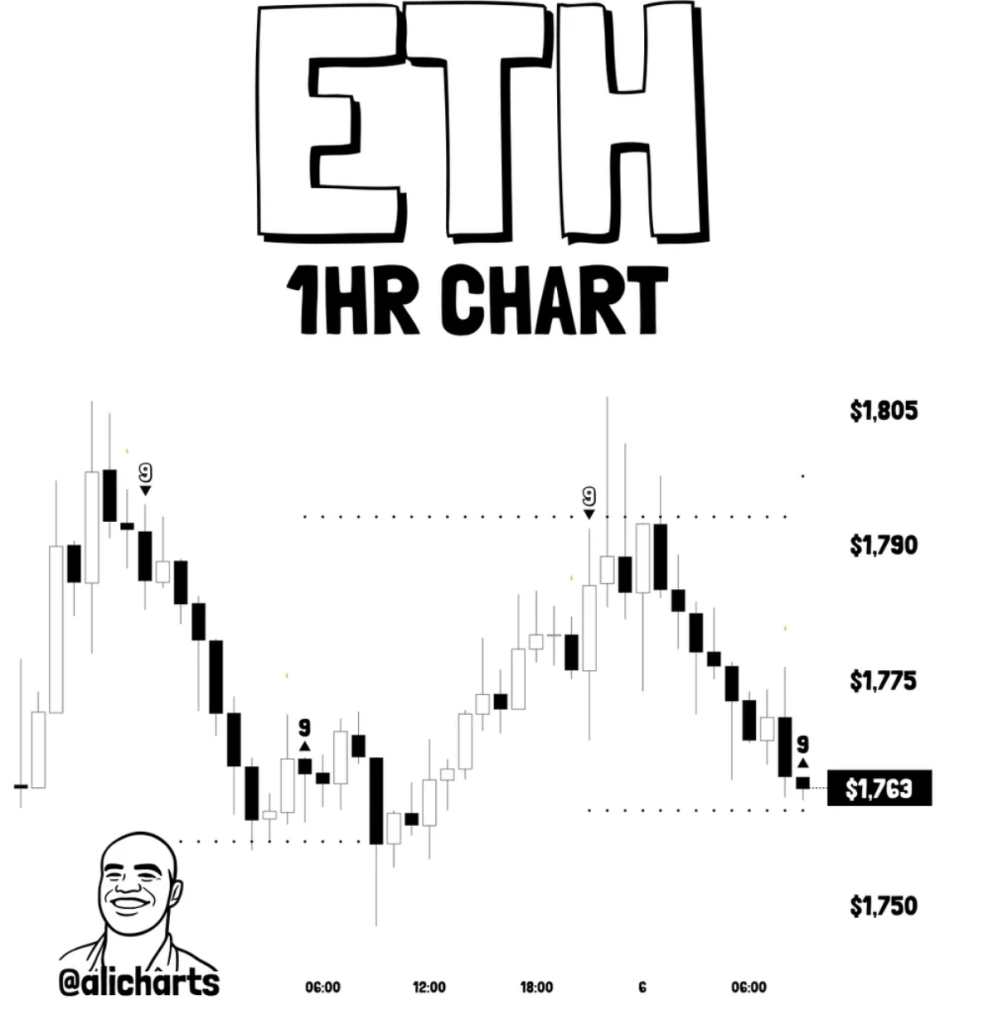
Crypto analyst Ali Martinez highlighted a fresh bullish development on Ethereum’s hourly chart.
According to Martinez, the TD Sequential indicator has printed a new buy signal, a pattern traders often use to identify potential trend reversals after periods of sustained selling.
The setup comes with one important condition.
Ethereum must continue holding above the $1,750 support area. If buyers successfully defend that level, Martinez believes ETH could make another push toward the $1,800 mark in the near term.
However, a decisive move below $1,750 would invalidate the current setup and weaken the short-term bullish outlook.
The TD Sequential indicator has earned a strong following among technical traders over the years because it has successfully identified several major turning points across both cryptocurrency and traditional financial markets. Like any indicator, though, it isn’t a guarantee. Most traders combine it with other technical signals before making decisions.
Momentum Indicators Continue Favoring Buyers
Ethereum’s broader technical picture also remains encouraging.
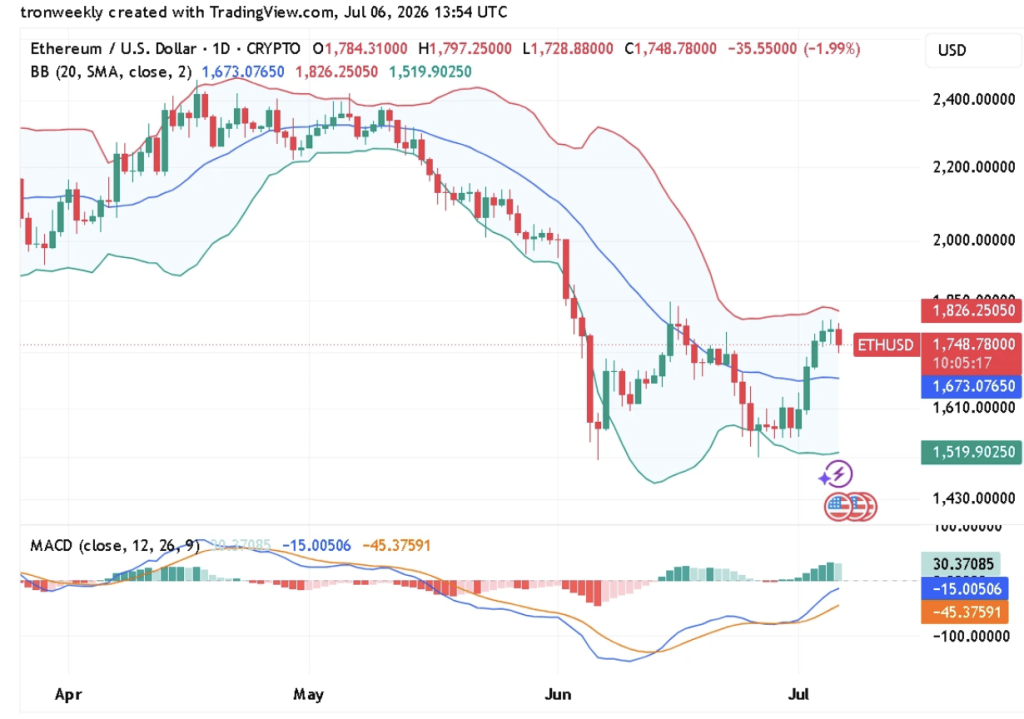
Price is currently trading above the middle Bollinger Band, which sits around $1,673. That generally suggests buyers still have the upper hand despite the recent pullback.
The upper Bollinger Band, located near $1,826, now represents the next major resistance area, while the lower band around $1,520 continues serving as broader downside support.
Momentum indicators tell a similar story.
The MACD has crossed into a bullish configuration, with the MACD line climbing above the signal line. That shift typically reflects strengthening buying momentum and suggests the recent recovery still has room to develop if demand continues building.
None of these indicators guarantee higher prices, of course. But together, they paint a picture of a market where bullish momentum hasn’t disappeared.
Why the $1,750 Level Matters
For Ethereum, the current price zone has become much more than just another support level.
The $1,750 area is now acting as the line separating bullish continuation from a potential short-term reversal.
If ETH continues trading above it, confidence among buyers could improve significantly, increasing the chances of another test of the $1,800-$1,826 resistance range.
On the other hand, losing that level would likely encourage sellers to regain control, potentially sending Ethereum back toward lower support zones before another recovery attempt begins.
That makes the coming trading sessions particularly important.
Ethereum’s Move Could Influence the Entire Altcoin Market
Ethereum isn’t just another cryptocurrency.
As the second-largest digital asset by market capitalization, its price movements often have a ripple effect across the broader altcoin market. When ETH gains momentum, many smaller cryptocurrencies tend to benefit as well. Likewise, weakness in Ethereum frequently spills over into the rest of the sector.
That’s one reason traders are paying such close attention to its current technical setup.
Can ETH Push Above $1,800?
The next few trading sessions may determine whether Ethereum’s recovery continues gathering momentum or loses steam.
Holding above the $1,750 support level would keep the TD Sequential buy signal active and strengthen the case for another move toward the $1,800-$1,826 resistance zone. A convincing breakout above that range could attract additional buying interest and reinforce the broader recovery.
If support fails, however, the current bullish setup would weaken considerably, increasing the likelihood of another pullback before Ethereum attempts its next advance.
For now, buyers still appear to have the edge—but they’ll need to defend one of the market’s most closely watched support levels to keep the recovery alive.