- Analysts remain divided on Solana, with some targeting $1,000 while others expect a drop toward $50 first.
- The key breakout zone for SOL currently sits near the important $98 to $100 resistance area.
- ETF inflows, institutional adoption, and the Alpenglow upgrade continue supporting long-term bullish sentiment around Solana.
Solana is once again sitting at a major technical crossroads, with analysts now outlining two very different scenarios for where SOL could head next. One side of the market sees the current range as a long-term accumulation zone that could eventually launch Solana toward dramatically higher Fibonacci targets. The other side warns that another painful correction may still come first before any larger breakout actually begins. Right now, both arguments are gaining attention because SOL continues hovering around a very sensitive price region.
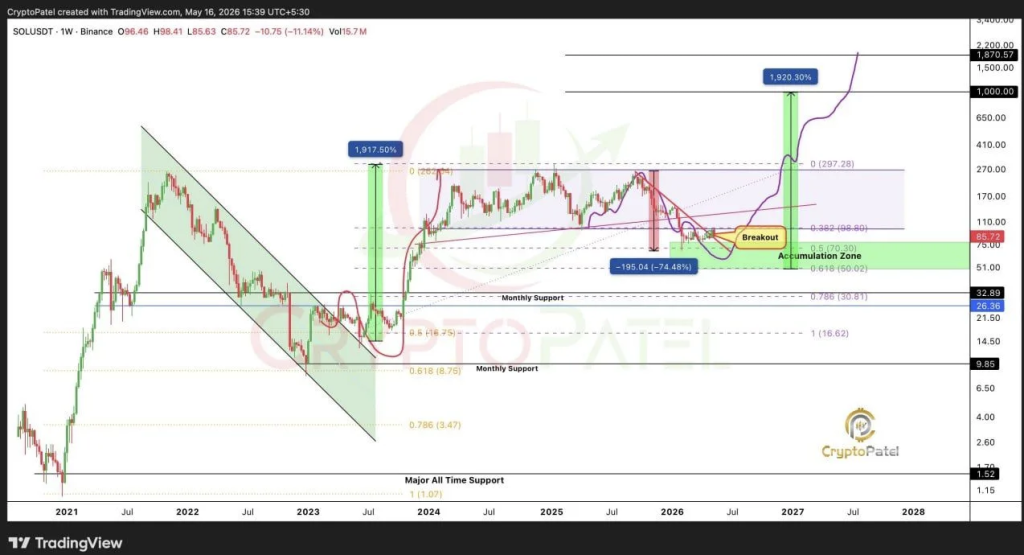
At the time of analysis, Solana traded near $85.72 on Binance, according to charts shared by crypto analyst Crypto Patel. His longer-term outlook paints an extremely bullish picture, suggesting SOL could eventually move from the current $80 range toward a potential $1,000 target over time. That projection might sound aggressive at first glance, but the chart structure he shared focuses heavily on broader market cycles, Fibonacci expansion levels, and growing institutional interest around the Solana ecosystem.
Solana Accumulation Zone Remains in Focus
Crypto Patel’s chart places Solana near the lower half of a wide long-term trading range following the sharp decline from its 2025 highs. The setup identifies an accumulation zone between roughly $50 and $70, with current prices now sitting slightly above that range but still below the most important breakout level. In other words, SOL hasn’t fully confirmed bullish continuation yet, though it also hasn’t completely lost its larger recovery structure either.
The biggest technical level on the chart sits near the 0.382 Fibonacci retracement around $98.80. If Solana manages to reclaim and hold above that area, the next upside targets on the chart move toward the previous resistance region between approximately $262 and $297. That would mark a huge recovery from current prices and potentially reopen discussions around even larger cycle targets later on.
At the same time, the chart also highlights several deeper support zones underneath the market. Key levels include $70.30, $50.02, $32.89, and even lower historical support regions near $16.62 and $9.85. Those levels matter because if momentum weakens again, traders may start revisiting them quickly.
ETFs, Institutional Demand, and Upgrades Fuel Bullish Sentiment
Part of the bullish argument surrounding Solana isn’t purely technical. Crypto Patel also listed several broader catalysts supporting the long-term outlook for SOL, especially as institutional adoption around crypto slowly expands. According to the post, Solana ETFs now reportedly hold close to 2% of total SOL supply, while cumulative ETF inflows have surpassed $1.12 billion with assets under management sitting near $1.01 billion.
The upcoming Alpenglow upgrade was also mentioned as a potentially major development for the network. The upgrade could reportedly reduce Solana transaction finality times from around 12.8 seconds down to just 150 milliseconds, a massive improvement if achieved successfully. Combined with staking yield opportunities offered by certain SOL ETF structures, some analysts believe Solana is positioning itself differently compared to Bitcoin and Ethereum products.
The post additionally referenced growing institutional ties involving firms and entities such as Morgan Stanley, Franklin Templeton, and even Dartmouth’s endowment. Legal clarity surrounding Solana’s classification as a digital commodity has also helped improve confidence across parts of the market.
Still, none of those bullish narratives fully matter unless SOL can first reclaim the critical $98 to $100 breakout region. Until that happens, Solana remains trapped between accumulation support and heavy overhead resistance.
Another Analyst Warns SOL Could Retest $50 First
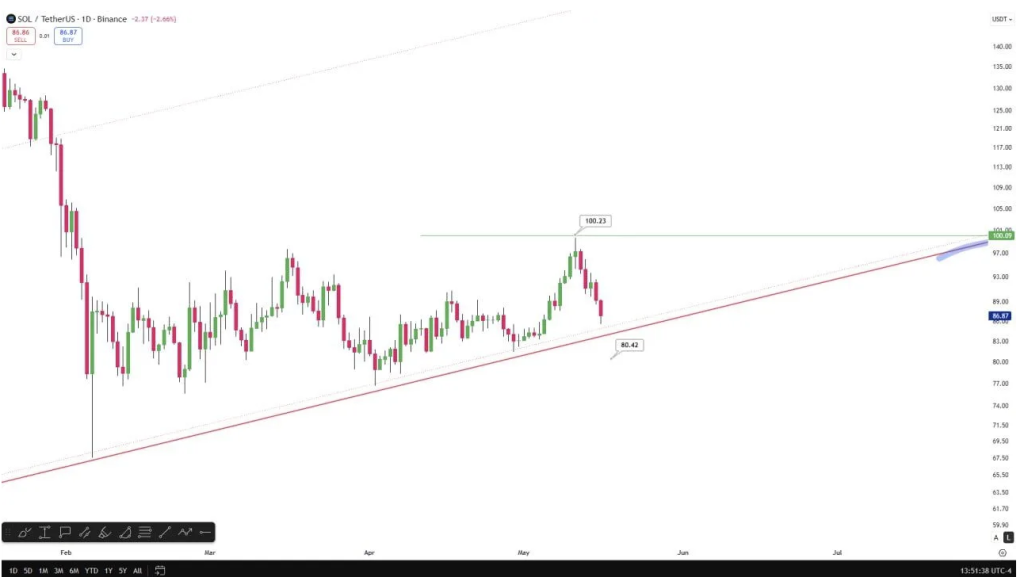
While the long-term outlook remains optimistic for some traders, another chart shared by analyst Celal Kucuker suggests Solana may first need to revisit lower support levels before any meaningful breakout develops. His daily chart shows SOL weakening after rejection near the important $100.23 resistance level, with price now drifting closer toward a rising support trendline near $80.42.
According to that setup, failure to hold the current trendline could open the door toward a deeper retracement into the $50 to $55 region. Kucuker noted that several earlier price targets around $68, $100, and $140 had already played out previously, leaving the next major levels near $50 to $55 on the downside and potentially above $300 on the upside later on.
For now, Solana’s next move probably depends on whether buyers can defend current support zones while eventually reclaiming the psychological $100 area. If they can’t, the market may see another painful reset before any larger bullish phase returns. Either way, volatility around SOL doesn’t seem to be disappearing anytime soon.