
- Peter Brandt warned Solana may be forming a bearish continuation pattern
- The analyst believes a downside break could potentially target the $43 region
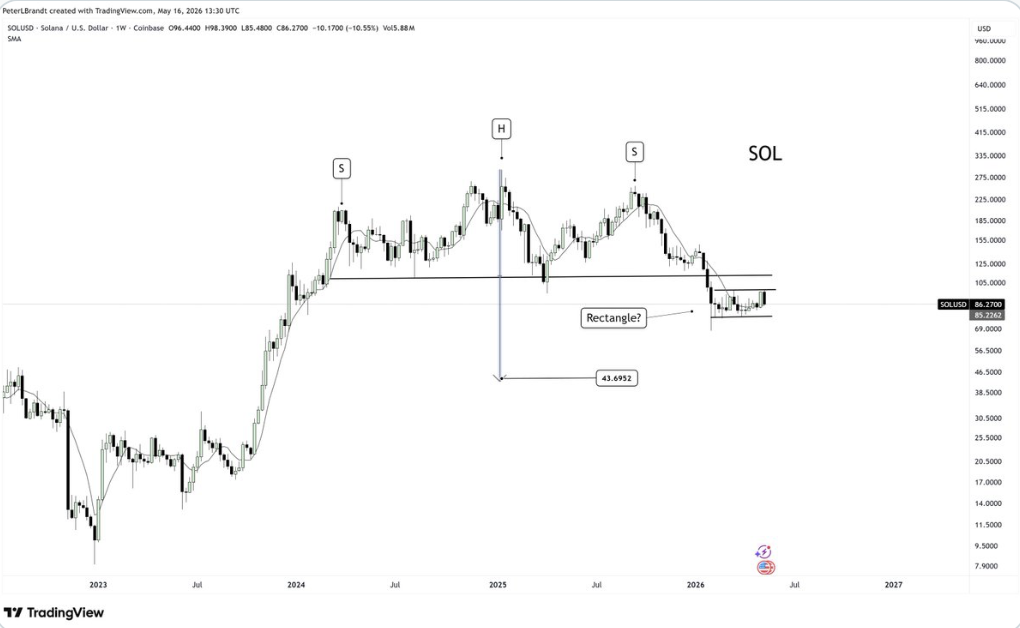
- SOL continues trading inside a 14-week consolidation range between major support and resistance
Veteran trader Peter Brandt is once again stirring debate across the crypto market, this time with a bearish warning aimed directly at Solana. According to the well-known chart analyst, SOL may be forming a dangerous technical structure that could potentially trigger another major breakdown if key support levels fail.
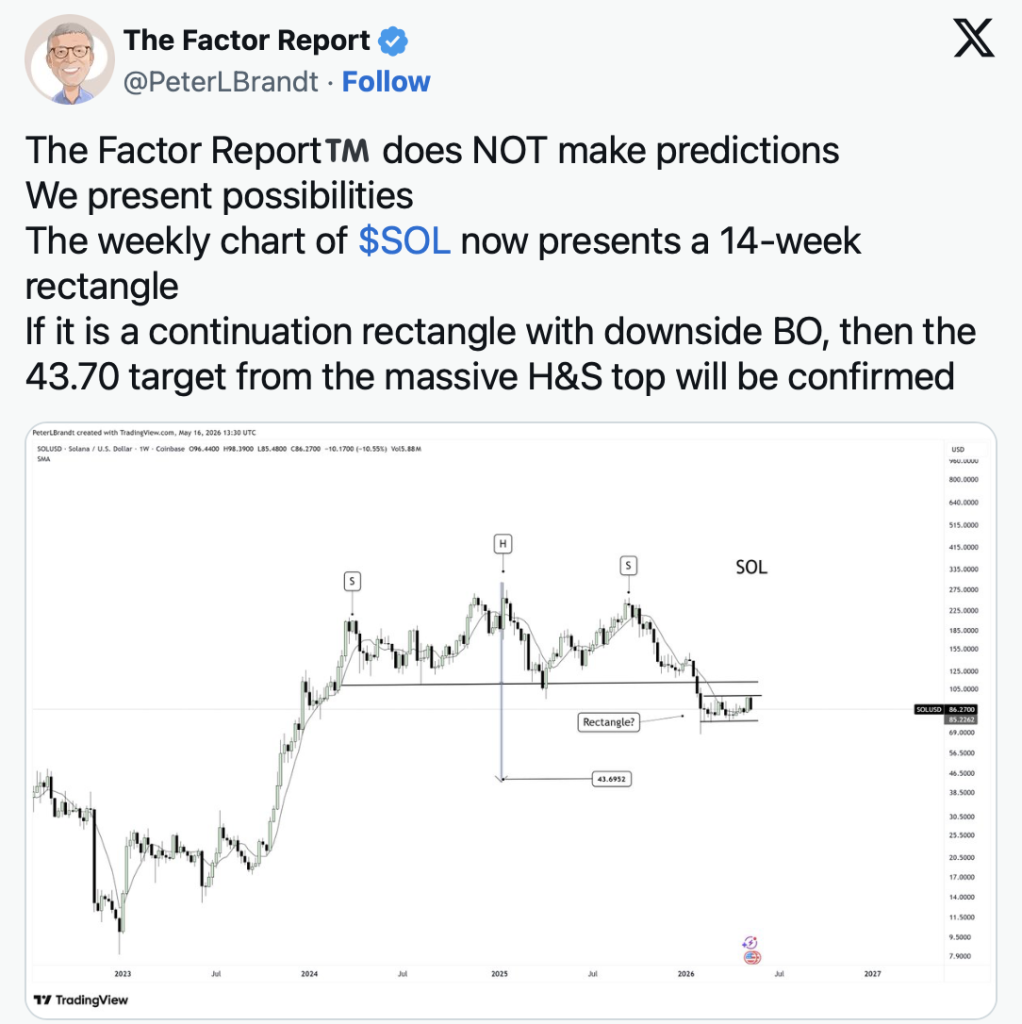
Brandt pointed specifically to what he described as a 14-week rectangle pattern currently trapping Solana’s price action. In technical analysis, those formations can sometimes act as continuation patterns — meaning the previous trend resumes once price finally breaks out of the range.
And in Solana’s case, the previous trend was clearly bearish.
If the pattern eventually breaks downward, Brandt believes it could validate a much larger head-and-shoulders top formation, one of the more closely watched bearish reversal setups in traditional chart analysis. Based on his projection, the downside target could stretch toward roughly $43.70, representing an extremely painful correction from current prices.
Still, Brandt also clarified that he was presenting possible scenarios rather than outright predictions. That distinction matters because crypto markets remain highly volatile and often invalidate technical setups unexpectedly.
Solana Has Struggled Since Its Major Rally Peak
Solana’s chart has looked noticeably weaker ever since the token peaked near $260 back in October. Since then, SOL has gone through several sharp selloffs that gradually erased much of its previous bullish momentum.
By early December, the token had already broken below multiple major support zones and eventually fell toward the $130 region. A brief recovery attempt followed during late December and early January 2026, where SOL managed to rebound toward $150, but buyers ultimately failed to sustain momentum long enough for a larger breakout.
Things became even more painful in February when the broader crypto market entered another heavy correction phase. Solana crashed below the key psychological $100 support level and eventually bottomed near the low-$70 range during peak capitulation.
Since then, the market has largely remained trapped inside the same sideways structure Brandt is now warning about.
The 14-Week Range Has Become Critical
According to Brandt’s analysis, Solana has spent roughly 14 weeks consolidating inside a wide rectangle formation. Price repeatedly bounced from support in the low-$70 area while facing heavy rejection below the $100 resistance zone.
At the time of writing, SOL was trading around $86.97, sitting almost directly in the middle of that range. Earlier in May, buyers briefly attempted another breakout toward the mid-$90s, but the rally lost momentum again before resistance could fully break.
That failure is part of why traders are becoming increasingly cautious now.
If SOL eventually loses support near the bottom of the rectangle, technical traders would likely begin watching Brandt’s bearish projection much more seriously. On the other hand, if Solana somehow breaks convincingly above the upper resistance zone, the entire bearish continuation thesis could weaken substantially.
Broader Market Conditions Still Matter
It’s also important to remember that Solana’s direction probably won’t depend entirely on chart patterns alone. Broader crypto market sentiment, Bitcoin’s stability, macroeconomic conditions, and institutional liquidity flows will likely continue influencing SOL heavily in the coming weeks.
Right now, crypto markets generally remain fragile as rising Treasury yields, inflation concerns, and global uncertainty continue creating pressure across risk assets. Under those conditions, altcoins like Solana tend to experience amplified volatility compared to Bitcoin itself.
For now though, Peter Brandt’s warning has clearly placed extra attention on Solana’s current structure. Whether the 14-week range becomes a launchpad for recovery or the setup for another deeper correction may ultimately determine SOL’s next major trend.