- Solana is struggling to break a dense resistance zone around the mid $80s in the short term
- Strong support below could trigger a pullback if resistance continues to hold
- A larger weekly megaphone pattern still suggests a possible long-term breakout toward higher levels
Solana is starting to press up against a pretty important resistance zone, at least in the short term, while a much larger setup quietly builds in the background. It’s kind of a split picture right now—one chart shows hesitation, the other hints at something way bigger still waiting to unfold. Put them together, and you get a market that feels… undecided, almost like it’s pausing before picking a direction.
Tight Range Forms as SOL Tests Immediate Ceiling
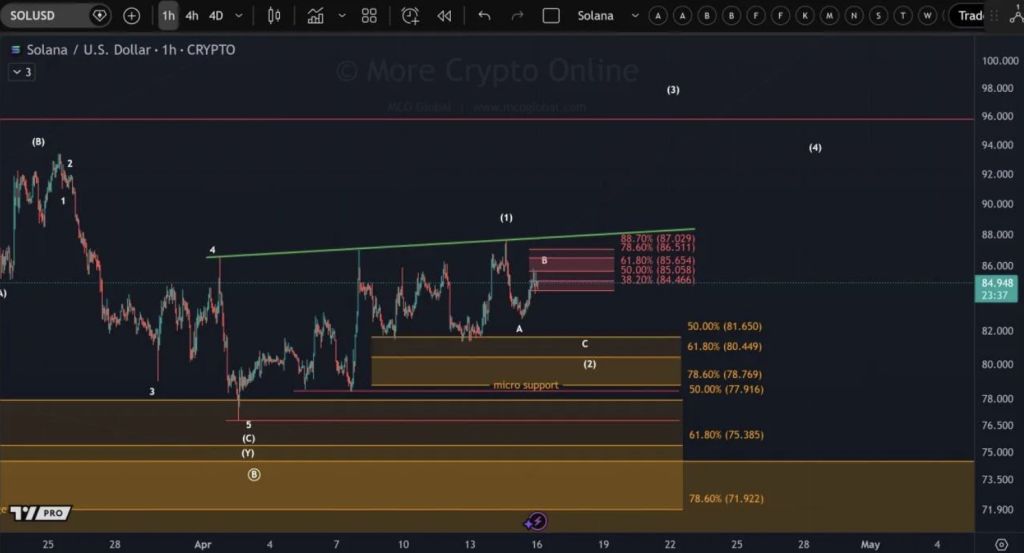
On the lower timeframe, SOL is pushing into a resistance band around the mid $84 area, and it’s not exactly gliding through it. After bouncing from a support zone between roughly $78 and $81, buyers managed to lift price back up, but that upward push has started to slow as it meets this cluster of resistance. It’s not rejection yet, but it’s also not a clean breakout—somewhere in between, which can be frustrating if you’re trying to catch momentum early.
What makes this area tricky is the stack of Fibonacci levels sitting close together—around $84.46, $85.06, $85.56, up toward $87. Because they’re packed so tightly, it creates more of a wall than a single line. And when price approaches that kind of zone after a smaller bounce instead of a strong rally, it usually takes more than one attempt to break through… if it breaks at all.
Support Still Holds, But Risk of Rotation Remains
Below the current price, the key support sits between about $81.65 and the high $77 range, with a smaller cushion just above $78 acting as micro support. If SOL can’t push through resistance here, there’s a decent chance it drifts back down into that demand zone again—it’s a level that’s already proven it can attract buyers, at least for now.
But if things flip the other way, and buyers actually manage to reclaim and hold above that resistance cluster, the structure opens up quite a bit. There’s room toward the upper $87 to $88 region, where a trendline sits waiting. That move would feel different—less choppy, more directional… though, again, confirmation matters here more than anticipation.
A Larger Pattern Quietly Suggests Much Higher Targets
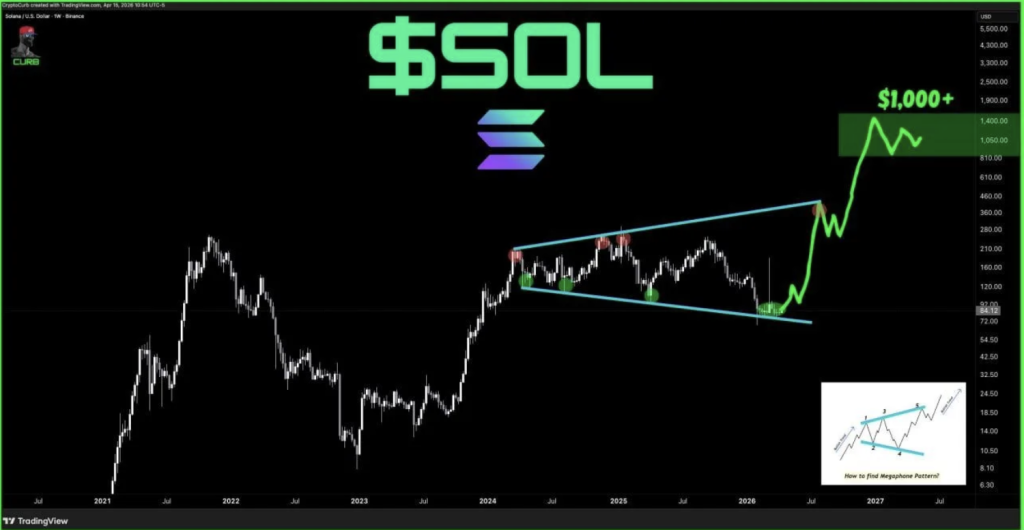
Zooming out to the weekly chart, the tone changes completely. Instead of tight ranges and short-term friction, there’s a broadening pattern—often called a megaphone—that hints the cycle might not be done yet. This structure shows price swinging between expanding highs and lows, touching both resistance and support multiple times before settling back near the lower boundary.
That lower boundary is key. As long as it holds, the overall pattern stays intact, and the idea of a larger breakout remains on the table. It’s less about what happens in the next few days and more about whether the structure continues to build pressure over time.
The Bigger Move Depends on Confirmation
If this megaphone pattern plays out fully, the projection points to a breakout above the upper boundary, followed by a sharp move higher. The long-term target shown sits above $1,000, which, to be fair, is more of a cycle-level estimate than something immediate or guaranteed. It’s the kind of projection that only becomes relevant if the structure actually confirms.
For now, Solana sits in an interesting spot—short-term resistance is keeping things in check, while the bigger picture still leans bullish, but only conditionally. If both timeframes start to align, that’s when things could get… a lot more interesting.