
- Solana shows conflicting signals with both bearish and bullish chart setups forming
- A repeated pattern suggests downside risk if key resistance around $86 holds strong
- A breakout retest scenario could trigger recovery if support levels remain intact
Solana is, oddly enough, sitting in a kind of tug-of-war between two very different technical views. One chart leans bearish, hinting at another drop that might not be so gentle, while another quietly suggests a recovery could already be forming beneath the surface. It’s not exactly rare to see conflicting setups like this, but the contrast here feels sharper than usual. Traders are left watching closely, because whichever side plays out could define SOL’s next real move.
Bearish Pattern Still Lingers Beneath the Surface
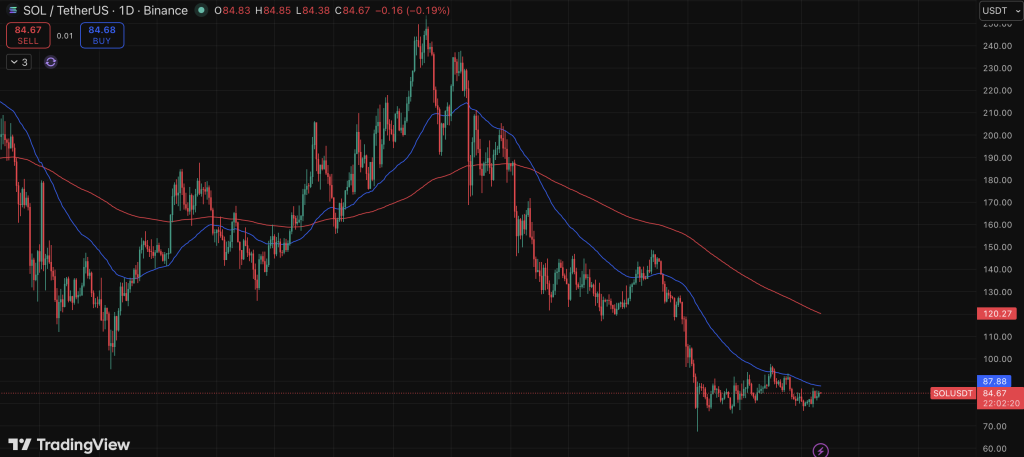
According to analyst Ali Charts, Solana has been repeating a three-step pattern since late 2025, and it’s not the kind bulls like to see. First, price climbs above the 50-day simple moving average, then it slips back under it, and after that… things go quiet for a bit before dropping again. Right now, SOL is hovering below that key level, trading around the high $70s while the 50-day average sits closer to the mid-$80s. It’s a bit uncomfortable, honestly, because previous cycles that looked like this didn’t end well, with prices eventually sliding toward deeper lows.
That sideways movement between roughly $79 and $81 might look like stability at first glance, but the analyst suggests it’s more of a pause than a foundation. Similar setups in November 2025 and January 2026 followed almost the exact same rhythm, and both times they led to sharper declines after a short lull. If this pattern repeats again, and it might, Solana could be staring at a move down toward the $50 range. Still, nothing is guaranteed here, patterns break all the time, but the risk hasn’t exactly disappeared either.
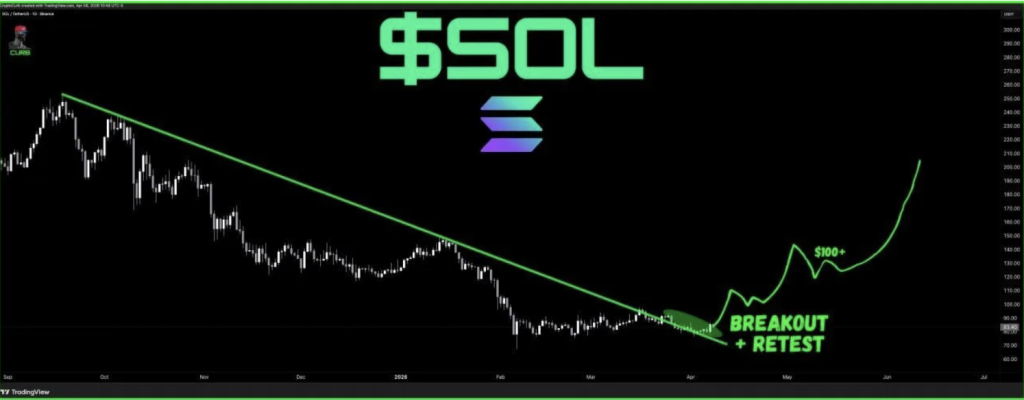
Breakout Retest Offers a More Hopeful Scenario
On the flip side, CryptoCurb’s chart paints a more optimistic picture, though it depends on a key detail holding firm. The idea here is simple but important: Solana may have already broken out of a long-term downward trendline and is now retesting it from above. That retest, if it sticks, could signal a shift in momentum, where old resistance quietly flips into support. It’s one of those classic technical setups traders tend to respect, even if it doesn’t always work out perfectly.
The chart outlines a potential path where SOL regains strength, climbs back above $100, and possibly builds momentum from there. It’s not a straight line, of course, markets rarely move that cleanly, but the structure suggests the downtrend might be losing its grip. If buyers manage to defend that retest zone, it could mark the beginning of something more sustained, maybe even a broader recovery phase.
A Crossroads Moment for Solana
What makes this situation tricky is that both scenarios feel plausible, almost equally so. The bearish structure hasn’t fully played out yet, but it hasn’t been invalidated either, and the bullish breakout still depends on holding key levels. In a way, Solana is stuck in between, not quite breaking down, not fully breaking out. That tension tends to resolve eventually, sometimes faster than expected.
For now, the $85–$86 region remains a critical line in the sand, and how price reacts around it could decide everything. A strong reclaim might weaken the bearish case, while continued rejection could reinforce it. Either way, Solana isn’t drifting aimlessly, it’s coiling, and the next move, whichever direction it leans, might not be subtle.