- Solana enters a clear downtrend after losing key support levels
- Technical indicators confirm bearish momentum with limited recovery signals
- Long-term structure suggests potential for a strong breakout after consolidation
Solana has started to look… noticeably weaker as March wraps up. What was once a long stretch of sideways consolidation has now shifted into something more clearly bearish, and the change didn’t happen quietly either.
Repeated failures to break above the $200–$240 zone seem to have done the damage. Buyers just couldn’t push through, and eventually, sellers took over. Once price dropped below $125, and then $110, it wasn’t just another dip, it marked a structural shift. What used to act as support is now gone, and the whole pattern has flipped from accumulation to distribution.
Momentum Turns Negative Across Indicators
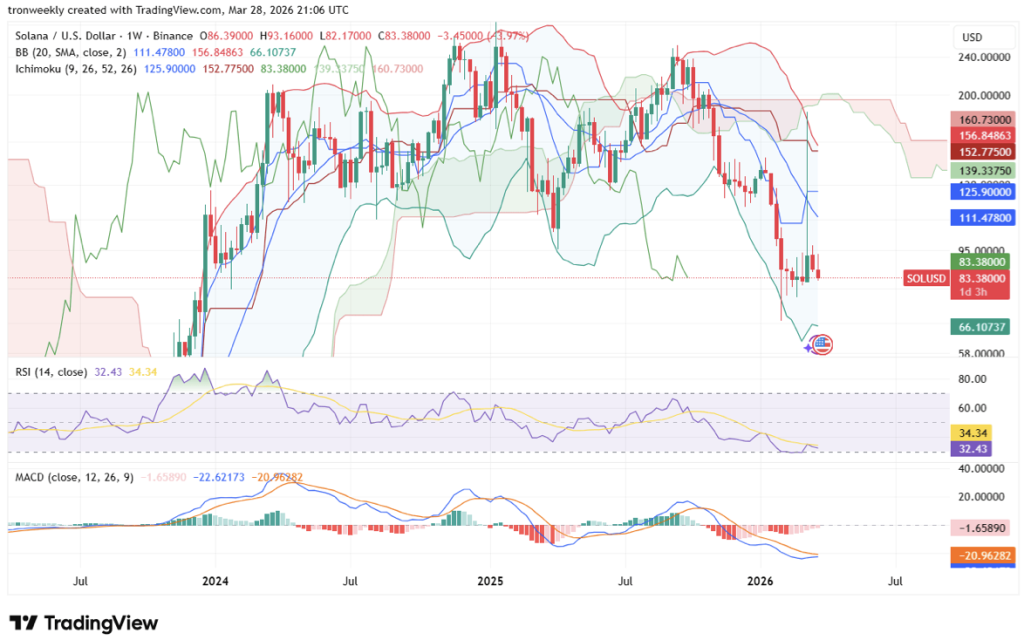
From a technical standpoint, the pressure is pretty obvious. Bollinger Bands are widening to the downside, which usually signals increasing volatility, but not in a good way. Price is hugging the lower band, and that tends to reflect persistent selling.
The $110–$115 range has now flipped into resistance. So even if price tries to bounce, that zone could act like a ceiling. It’s one of those situations where rallies might get sold into rather than extended.
The Ichimoku Cloud isn’t helping either. Price is sitting well below it, and both the baseline and conversion lines are pointing downward. That’s usually a sign the trend hasn’t turned yet, not even close.
RSI is hovering in the low 30s, almost oversold, but not quite showing any real reversal signal. And while the MACD still leans bearish, it does hint that selling pressure might be slowing a bit… maybe. Not enough to flip things, but enough to suggest a possible pause.
Key Levels Now Define the Short-Term Path
Right now, the $80–$85 area is acting as support, and it’s an important one. It has held before, and there’s some psychological weight behind it too. If this level holds, SOL might stabilize, at least temporarily.
But if it breaks, the next demand zone sits lower, around $65–$70. That’s where buyers previously stepped in, and it could happen again.
On the upside, resistance is stacked. There’s a barrier around $95, and then a much stronger one between $110 and $125. The problem is, those used to be support levels, and once they flip, reclaiming them becomes… difficult.
Bigger Picture Still Leaves Room for Upside
Despite all this short-term weakness, the long-term story hasn’t completely broken down. Some analysts still see Solana as a much higher-value asset over time, even pointing to potential targets far above current levels.
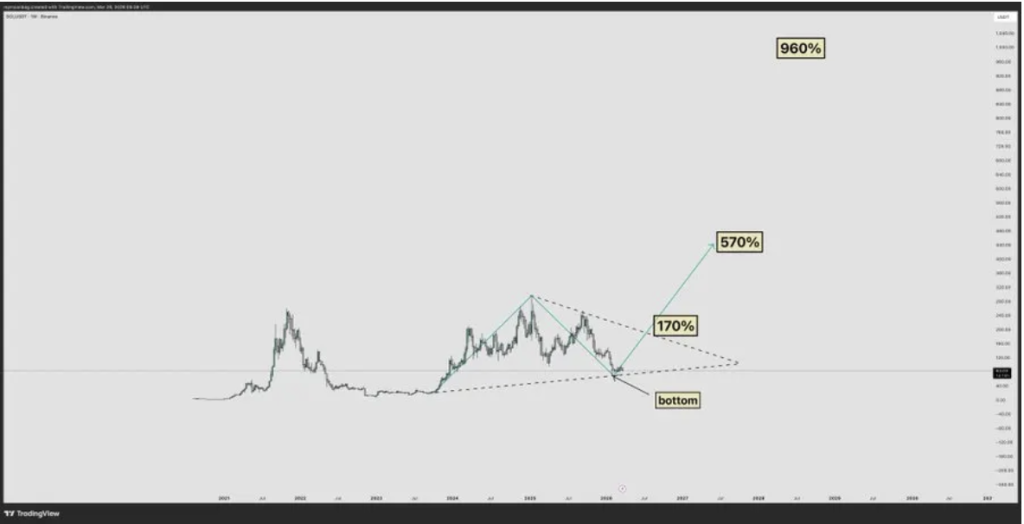
Looking at the broader structure, price seems to be forming a tightening pattern, something like a symmetrical triangle. That usually means compression, where neither buyers nor sellers fully dominate.
And when that kind of structure resolves, it tends to move hard in one direction.
A Setup That Could Lead to a Bigger Move
If history is anything to go by, these phases of contraction often come before expansion. Estimates floating around suggest a breakout could lead to moves of 170% or more, depending on how strong momentum gets.
In a full cycle, even larger gains aren’t out of the question, though that’s more long-term thinking than immediate reality.
For now, Solana is clearly under pressure. But at the same time, it might be building something beneath the surface. The short-term trend is bearish, no doubt… but the long-term setup still leaves room for a different outcome.