
- Ethereum is consolidating between $2,050 and $2,300, showing signs of accumulation
- On-chain data suggests ETH may be in a historically undervalued zone
- A breakout above $2,300 could push ETH toward the $2,500 range short term
Ethereum, still sitting comfortably as the second-largest crypto by market cap, continues to play a central role in powering decentralized apps and smart contracts. Lately though, the focus has shifted more toward its price behavior, which, honestly, has been a bit mixed. At the time of writing, ETH is trading around $2,111.57, down roughly 3.37% over the past day, not a dramatic drop, but enough to keep traders cautious.
Even so, there’s a growing sense that something might be building beneath the surface. Some forecasts are pointing toward a move closer to $2,500 by the end of March 2026, assuming momentum doesn’t fade out. It’s not guaranteed, of course… but the signals are starting to line up in a way that’s getting attention.
Tight Range Signals Quiet Accumulation
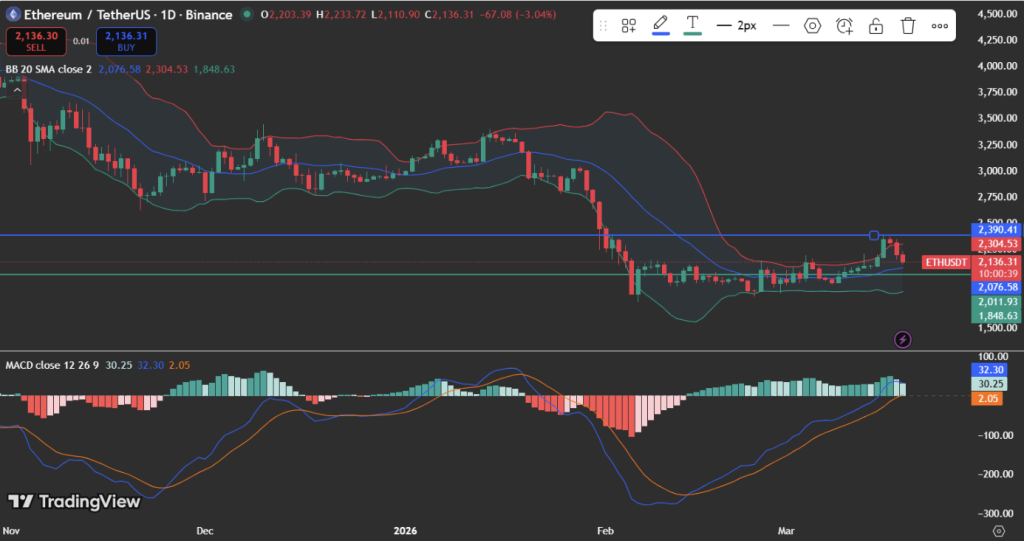
Looking at the charts, Ethereum has been consolidating within a fairly tight range, bouncing between support near $2,050 and resistance around $2,300. After a noticeable decline earlier, this kind of sideways movement often hints at stabilization, maybe even accumulation, though it doesn’t always play out that way.
One detail that stands out is the formation of higher lows. It’s subtle, but it suggests buyers are stepping in a bit earlier each time the price dips, slowly building positions. That doesn’t mean a breakout is imminent, but it does show underlying strength, even while ETH struggles to reclaim higher levels.
Momentum indicators are starting to reflect this shift too. The MACD, for instance, is leaning positive, hinting that a breakout could be on the table if ETH manages to push above $2,300 with solid volume behind it. Without that confirmation though, it’s still just potential.

On-Chain Data Points to a Possible Bottom
Beyond the charts, on-chain metrics are adding another layer to the story. According to Ali Charts, Ethereum is currently trading within what’s considered a historically significant accumulation zone, based on the MVRV ratio. That metric compares market value to realized value, and right now, it’s suggesting ETH may be undervalued relative to past cycles.
This kind of setup has, in previous market phases, aligned with bottoming periods. Not always perfectly, but often enough that traders pay attention. The current price action, paired with this data, does seem to support the idea that Ethereum could be entering a broader recovery phase… slowly, not all at once.
Can ETH Push Toward $2,500 This Month?
Forecast models are leaning optimistic, at least in the short term. CoinCodex projections place ETH around $2,488 by March 30 and potentially $2,527 by March 31, which would mark a 16% to 18% move from current levels. That’s a decent jump, though it depends heavily on one key factor.
Ethereum needs to break above $2,300 first, and hold it. That level has become a kind of psychological barrier, and without a clean breakout, upside targets start to look less convincing. If it does clear that zone, though, momentum could build quickly.
Still, this is crypto. Volatility is always part of the picture, and things can shift fast, sometimes without much warning. For now, Ethereum sits right in the middle… not bearish, not fully bullish either, just waiting for its next move.