
- SUI’s next move may depend on whether the RSI trendline on its BTC pair breaks or holds.
- A breakdown could push the price toward $0.82, while a bounce may target $0.94.
- The $0.89 support level remains critical, with analysts watching for a potential recovery toward $1.05 if it holds.
SUI is slowly drifting toward a moment that could decide its next direction. After weeks of pressure and uneven price action, analysts are now focusing on a very specific signal—the RSI trendline on SUI’s BTC trading pair. It may sound technical, but sometimes these small signals end up guiding the bigger move.
Right now the market feels… uncertain. Not collapsing, not recovering either. Instead, SUI is hovering near levels where even a minor shift in momentum could push things one way or the other.
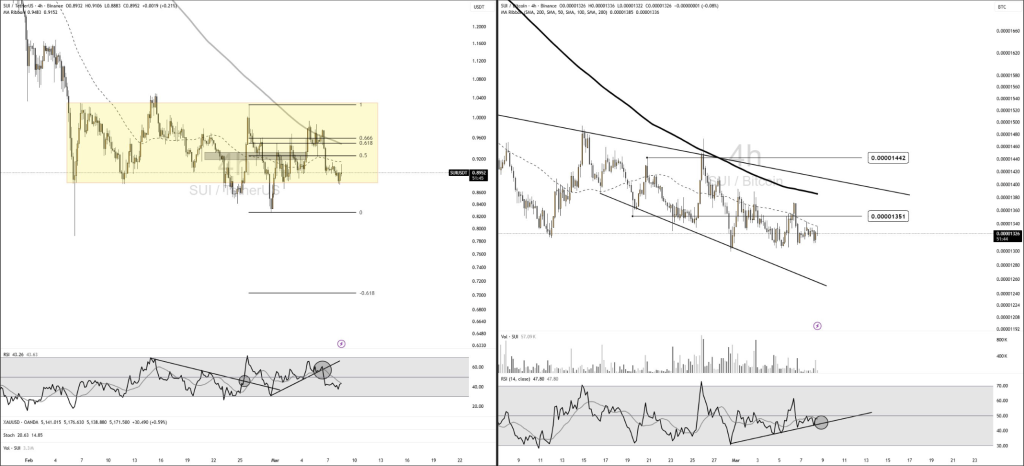
The BTC Pair RSI Could Decide What Happens Next
According to crypto analyst Umair Crypto, SUI’s immediate trajectory may depend heavily on what happens to the RSI trendline on its Bitcoin trading pair. In his latest market update, he explained that this line has quietly been acting as a structural guide for momentum.
If the RSI breaks below that trendline, things could get messy fairly quickly. A breakdown would likely signal that bearish pressure is gaining strength again, potentially pushing the token down toward the $0.82 region.
While much of the focus remains on the BTC pair, the USDT pair already looks a bit shaky. Price has been hovering near the bottom of its range, which often suggests that buyers are losing some control. It’s not a collapse, but the pressure is there.
That’s why traders are watching the BTC pair closely. If the RSI trendline breaks, the USDT range may follow shortly after.
Umair outlined two clear possibilities.
In the first scenario, the RSI trendline fails. That breakdown would likely trigger renewed selling pressure, weakening the USDT pair’s support zone and opening the door for a slide below $0.82.
The second scenario is more constructive, at least short term. If the RSI holds its structure and momentum stabilizes, SUI could attempt a bounce. In that case, the price might climb toward the $0.94 resistance level.
Even then though, the broader market bias still leans bearish. A move to $0.94 would probably be viewed as a relief bounce rather than a full trend reversal. In other words, it could be a pause in the downtrend—not necessarily the end of it.
SUI Attempts to Stabilize Around the $0.89 Support Zone
Another perspective comes from analyst BitGuru, who recently pointed out that SUI may be entering a stabilization phase after a prolonged period of downward pressure. The asset has already moved through several waves of consolidation, and those patterns sometimes appear when selling momentum starts to run out of steam.
At the center of this discussion is the $0.89 support level.
Right now, SUI is holding just above that area. And as long as buyers continue defending it, the broader technical structure remains somewhat constructive. Markets often form their bases in places like this—slow, quiet stabilization before a larger move eventually unfolds.
If that support zone holds, analysts believe the first recovery targets could sit between $1.01 and $1.05. That range marks the next significant resistance area where sellers may try to regain control.
For the moment, though, the market is still waiting for confirmation. SUI hasn’t broken down, but it hasn’t reclaimed strength either. The price is simply hovering near support while momentum indicators slowly adjust.
Sometimes the most important moves begin exactly like this… quietly, with everyone watching the same line on the chart.