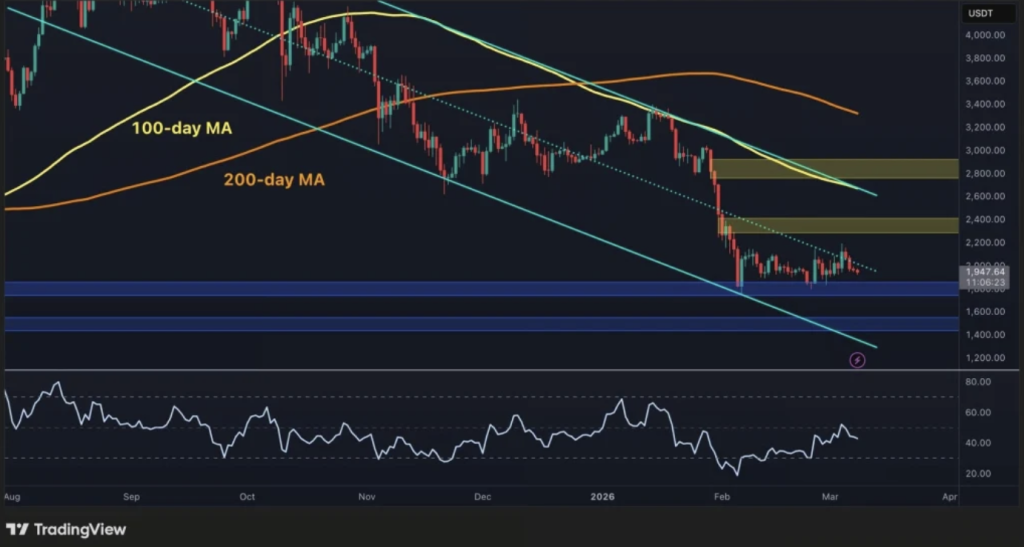
- Ethereum continues trading below its 100-day and 200-day moving averages.
- Key support sits near $1,900 while resistance remains around $2,400 and $2,800.
- Rising trading volume but falling open interest reflects a cautious market environment.
Ethereum has been having a tough time finding real momentum on the higher time frames. The price is still trapped inside a broader bearish structure, and despite a few attempts to bounce, the recovery hasn’t really taken hold yet. After stabilizing near the $1,900 level in February, ETH managed to stop the immediate decline, but the overall trend still feels heavy.
A big part of the problem comes from where the price is sitting relative to its major moving averages. Ethereum continues to trade below both the 100-day and the 200-day moving averages, and importantly, both of those indicators are sloping downward. That usually signals that the broader market direction hasn’t changed yet. Every time ETH tries to push above these areas, the move fades pretty quickly.
Descending Channel Continues to Control Price
Looking at the chart structure, Ethereum has been respecting a descending channel for several months now. The pattern has been fairly consistent: the price pushes up toward the upper boundary, sellers step in, and the market rolls back down again.
Right now, ETH is hovering just above a support zone near $1,900 — the same region that held during the sharp drop in February. That level has acted as a temporary floor, but the upside hasn’t been particularly convincing so far. Resistance still sits higher up around $2,400, and beyond that near $2,800.
And every time the market edges closer to those levels, selling pressure seems to return almost immediately. It suggests that many traders are still using rallies as opportunities to exit positions rather than chase the price upward.
Analysts Outline Potential Recovery Path
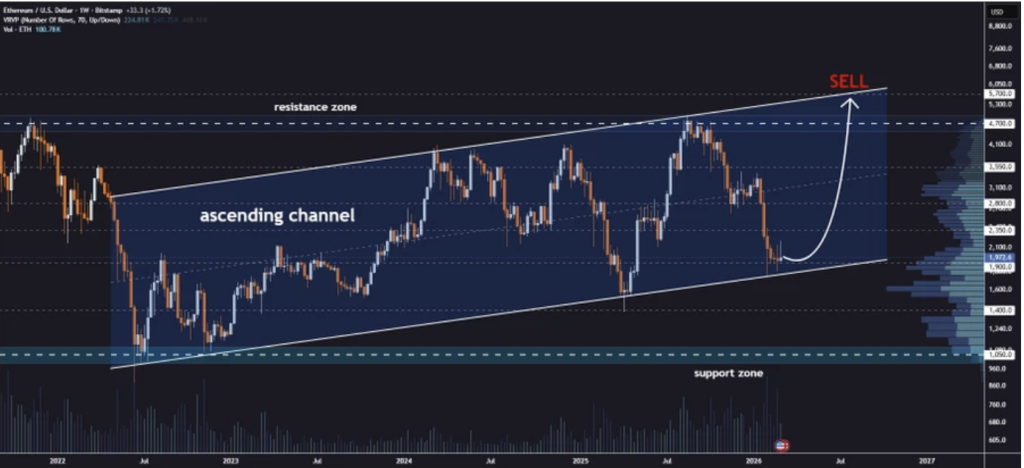
Not everyone is fully bearish though. Analyst Jonathan Carter recently pointed out that Ethereum actually bounced off the lower boundary of an ascending channel on the weekly timeframe. In other words, while the short-term structure looks weak, the broader setup might still allow for a recovery if support continues to hold.
Carter emphasized that the support area remains intact for now, which creates what he described as a relatively clean risk-to-reward scenario for traders watching the structure. If buyers continue defending the lower boundary, a gradual move upward could start forming.
He outlined several possible upside targets if momentum improves: $2,350, then $2,800, followed by larger levels near $3,550, $4,700, and even $5,700. Those numbers obviously depend on market strength returning though — without stronger buying pressure, they remain more like roadmap markers than immediate targets.
Market Data Shows Mixed Signals
Looking at derivatives data adds another layer to the picture. According to CoinGlass, Ethereum’s trading volume recently jumped by about 25.5%, reaching roughly $30.44 billion. Higher volume usually suggests increasing market participation.
But at the same time, open interest actually declined slightly, falling about 1.14% to $25.23 billion. That combination — rising volume with falling open interest — can sometimes indicate positions being closed rather than new ones opening.
Funding rates are also leaning slightly negative, sitting around -0.0053%. That suggests short positions still carry a small edge in the derivatives market.
For now, Ethereum remains stuck in a cautious environment. Buyers have managed to defend the $1,900 area so far, which is important… but until ETH can reclaim levels above $2,400 and break the descending resistance, the broader market structure still leans bearish.