
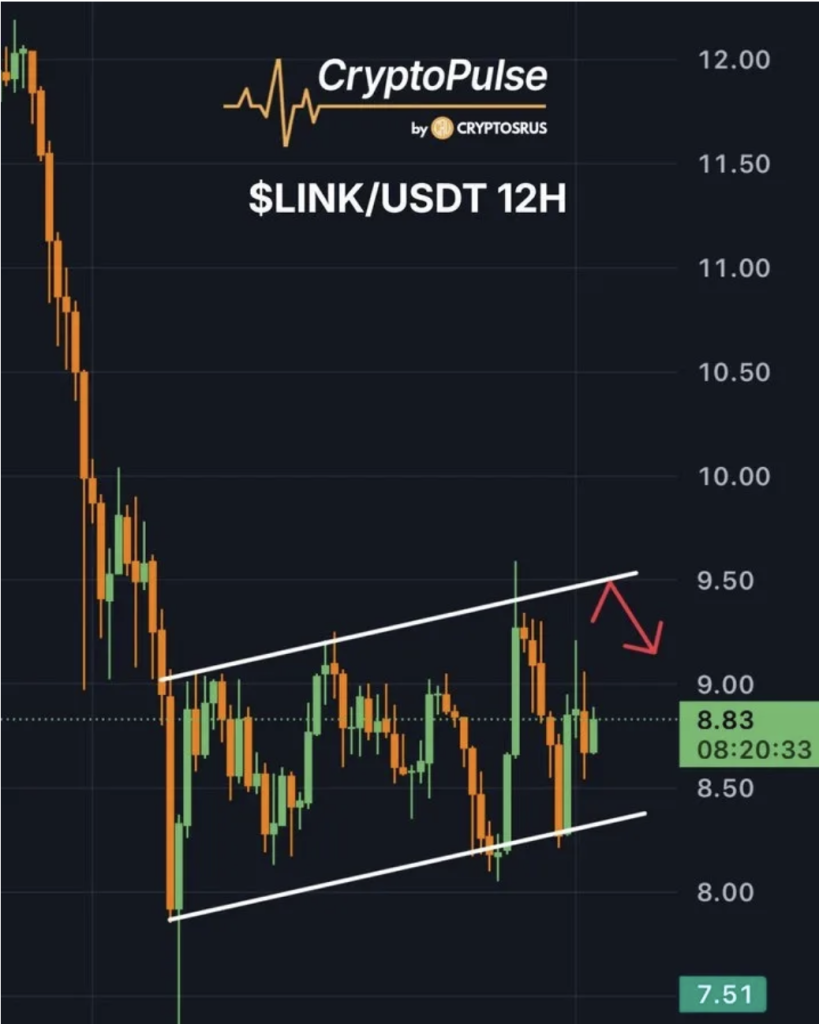
- LINK is forming a potential bear flag on the 12-hour chart, keeping downside risk active.
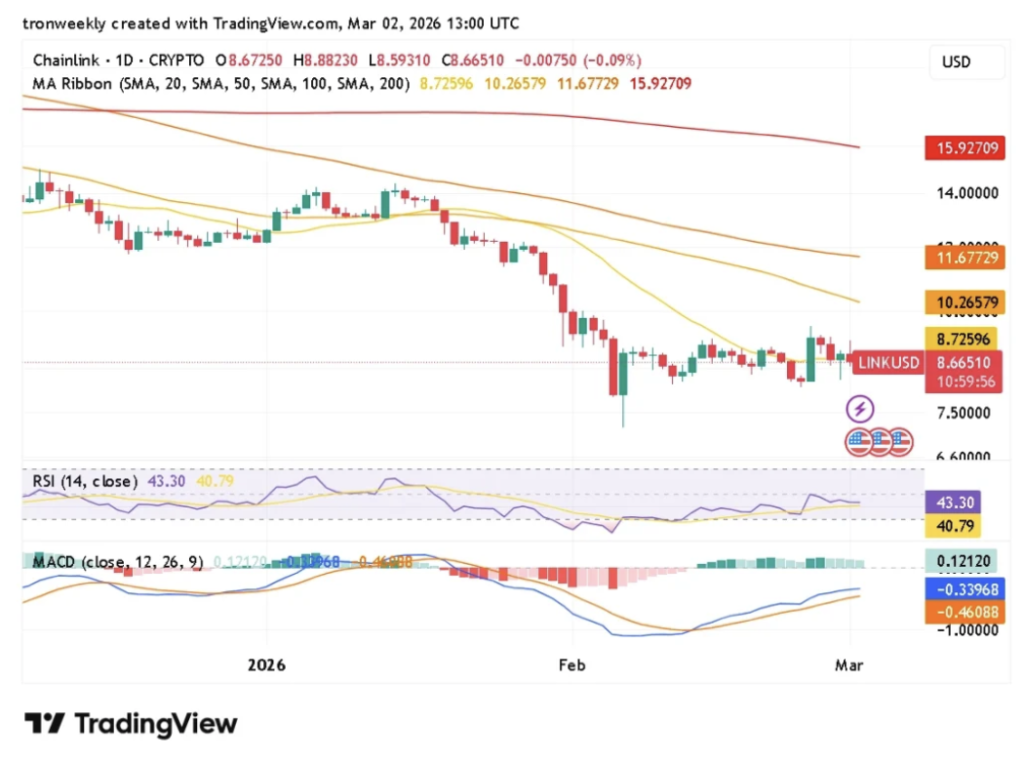
- The token remains below major daily moving averages, with $10 acting as key resistance.
- A failure to reclaim $10 could lead to a retest of $8.20 or lower support levels.
Chainlink is looking tired again.
After a sharp selloff, LINK attempted a bounce, but the recovery hasn’t shifted the broader structure. On the 12-hour chart, a potential bear flag is forming, the kind of pattern that often signals continuation rather than reversal. For now, price remains pinned below key moving averages, and that keeps the bearish bias intact.
At the time of writing, LINK trades near $8.60, with over $243 million in 24-hour volume and a market cap around $6.15 billion, according to CoinMarketCap. The token has slipped 4.16% in the past day. Not a collapse, but not exactly strength either.
Bear Flag Structure Raises Questions
According to crypto analyst CryptoPulse, LINK appears to be consolidating inside a gently rising channel after a steep drop. That structure fits the classic bear flag setup. In simple terms, price falls hard, drifts upward slowly, then risks rolling over again.
The key tension now is whether LINK drifts toward the upper boundary of that channel and fades back into the $8.20–$8.40 zone, or whether buyers step in with enough force to invalidate the pattern.
That invalidation level? Roughly $10.
A clean break and close above $10 would disrupt the bearish setup and potentially shift short-term sentiment back to bullish. Until that happens, rallies may just be pauses within a broader downtrend.
Moving Averages Still Act as Overhead Pressure
Technically, LINK remains under pressure because it trades below all major daily Simple Moving Averages. The 20-day SMA sits near $8.72 and acts as immediate resistance. Above that, the 50-day SMA at $10.26 forms a heavier ceiling.
And it doesn’t stop there.
The 100-day SMA hovers near $11.67, while the 200-day SMA looms at $15.93. That’s a stacked resistance structure. Even if LINK clears the first barrier, multiple layers still wait above.
Momentum indicators tell a cautious story. The RSI currently sits around 43.30, below the neutral 50 mark. That suggests bullish momentum hasn’t fully regained control. It’s not oversold. It’s just… subdued.
MACD offers a slight glimmer of short-term improvement. The MACD line, though still negative, has crossed slightly above the signal line, and the histogram has flipped positive. That could hint at a short-lived relief rally. But with the MACD still below zero, the broader trend hasn’t flipped.
It’s recovery within weakness, not strength within recovery.
What Comes Next for LINK?
If LINK fails to push through the upper boundary of the bear flag and remains below $10, downside risk stays active. A break under recent support could send price back toward $8.20 or even lower.
On the flip side, a strong higher-timeframe close above $10 would weaken the bearish thesis. That kind of move could attract fresh buying interest and shift momentum more decisively.
Until then, caution dominates the chart. The bounce hasn’t erased the decline. And in this structure, bears still have the upper hand, even if they’re not pressing aggressively right now.
LINK isn’t broken. But it isn’t convincing either.