- AAVE has rebounded nearly 30% from its $92 low but remains in a broader downtrend marked by lower highs and lower lows.
- Key resistance levels sit at $130 and $148, while the $80–$100 demand zone is critical for preventing deeper losses.
- On-chain signals like OBV remain slightly constructive, but declining TVL and ecosystem uncertainty add caution.
Aave has finally given long-term holders something to breathe about. Since printing a low at $92.25 on February 6, the DeFi token has climbed nearly 30%, a sharp bounce that caught attention. At the time of writing, AAVE trades around $119.64. That’s a meaningful recovery in just two weeks.
But zoom out, and the relief feels… temporary.
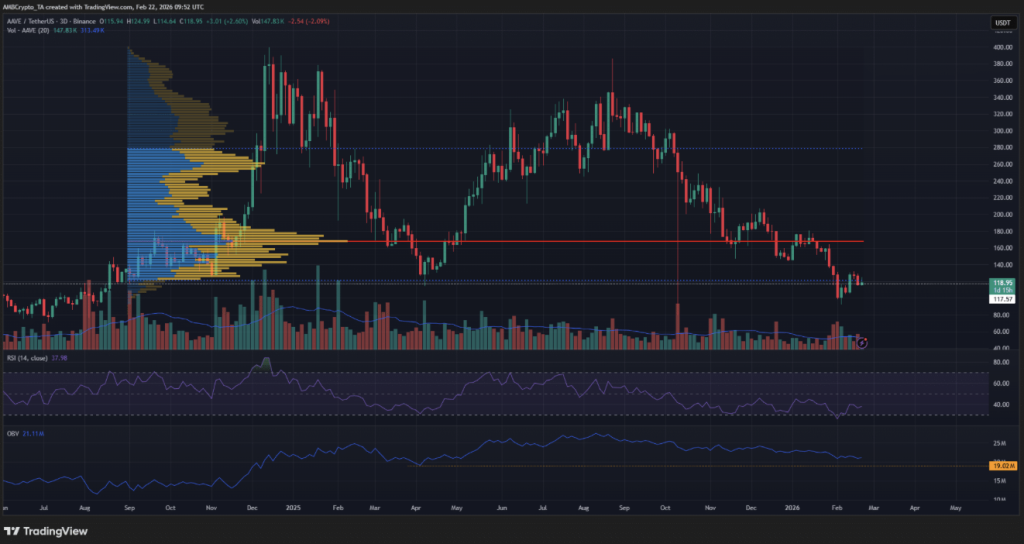
The 3-day chart still shows a clear pattern of lower highs and lower lows stretching back to late September. Structurally, that’s a downtrend. No way around it. Even though price has bounced, the broader direction hasn’t flipped yet.
Interestingly, the $117.57 level is not new territory. Back in summer 2024, this zone acted as stubborn resistance before bulls finally broke through in August. That breakout fueled a rally toward nearly $400 by year-end. Now AAVE is revisiting that same long-term level again, but under very different momentum conditions.
Volume Profile Highlights Heavy Supply Above
Using a Fixed Range Volume Profile from the August 2024 support-resistance flip to now, key levels become clear. The Value Area Low sits near $121.2, almost exactly where price is hovering. Above that, the Point of Control stands at $168, a zone that historically attracted the most trading activity.
This setup tells a subtle story. There’s significant supply overhead. Bulls are pushing into a region where volume previously clustered heavily, and that often slows momentum.
If AAVE fails to sustain above $120, attention shifts lower toward the $80–$100 demand zone. That region is critical. Lose it convincingly, and the risk of a deeper slide toward $50 later this year increases. Not immediately perhaps, but structurally.
One encouraging sign is the On-Balance Volume indicator. OBV remains above its April 2025 lows, suggesting accumulation hasn’t completely dried up. On top of that, Aave’s protocol revenue remains relatively strong, which supports long-term fundamentals even if price struggles short term.
Warning Signs Still Linger
Not everything is pointing upward. Total Value Locked briefly climbed to $27.7 billion, but over the past ten days, it has slipped back to around $26.3 billion. That decline, while not catastrophic, signals cooling capital flows.
There’s also ecosystem uncertainty. BGD Labs, a major service provider to the Aave DAO, is reportedly set to exit by early April. That news has stirred some division within the community. Governance transitions can create friction, even if temporary.
On the lower timeframe, the 4-hour chart reveals near-term friction at $130. That level has acted as a supply zone throughout February. Multiple attempts to break it suggest buyers are trying, but haven’t fully succeeded. If Bitcoin continues to strengthen, that external momentum could push AAVE above local resistance.
Beyond $130, the next major barrier sits around $148.6. Given the prevailing downtrend, that level is expected to attract selling pressure. However, a clean breakout above $163.9 would change the swing structure entirely. That would mark a shift from bearish continuation to potential recovery.
For now, AAVE sits in transition. A sharp rebound, yes. But the broader trend remains fragile. Bulls have work to do, and the chart isn’t forgiving. Not yet.