
- ADA is testing a long-standing demand zone near the lower edge of a bearish channel
- Resistance remains strong unless price can reclaim the channel’s mid-range and break higher
- Weekly indicators continue to favor sellers, keeping downside risk in focus
Cardano slipped into a critical technical area on January 25, with ADA trading near $0.3374 after dropping nearly 15% over the past week, according to CoinMarketCap data. Price is now hovering near a long-watched demand zone, one that traders tend to focus on when broader market conditions turn weak. This region has acted as a pressure point before, and its reaction now could shape ADA’s next move.
Despite the recent selloff, this zone isn’t unfamiliar territory. Historically, prolonged weakness around these levels has often drawn in patient buyers, especially when momentum starts to slow. Whether that happens again is the big question hanging over the chart right now.
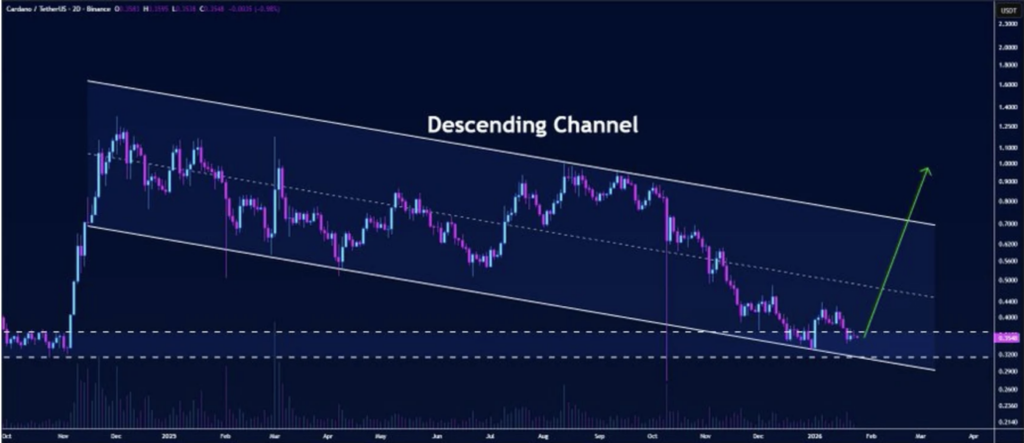
Bearish Channel Still Defines ADA’s Price Action
On the 2-day chart, ADA remains locked inside a clear descending channel. The structure reflects months of sustained selling pressure, with each rally attempt failing just before reaching the top of the channel. Lower highs and lower lows have kept the trend firmly pointed down, frustrating bullish setups along the way.
Recently, price has been consolidating near the lower boundary of that channel. This doesn’t mean a reversal is underway, but it can suggest that selling pressure is cooling, at least temporarily. Market analyst Butterfly noted on January 25 that ADA found support near the lower edge of this declining structure, an area that has historically attracted buyers as sellers lose momentum.
This kind of behavior is common when price spends extended time near lows. Accumulation tends to happen quietly, without dramatic candles or sudden spikes, which can make it easy to miss unless you’re watching closely.
Resistance Still Looms Above
Data from TradingView shows ADA continuing to follow the inner path of the downtrend, including the channel’s midpoint, which often acts as a balance zone. When price drifts too far from this midline, it tends to snap back before deciding its next direction. If buying pressure improves, ADA could attempt a move toward that middle range, though resistance remains heavy.
The upper boundary of the channel sits roughly between $0.60 and $0.70. That zone has repeatedly drawn sellers back into the market. Even a bounce from current levels would likely be viewed as corrective unless ADA can break above the channel and hold. On the downside, losing the $0.33 to $0.32 area would reinforce the bearish case and could accelerate the decline, keeping the channel structure intact.
Weekly Indicators Still Favor Sellers
The weekly chart paints a cautious picture. ADA remains below all major exponential moving averages, signaling that sellers still control the broader trend. The EMA 20 sits near $0.50, while the 50, 100, and 200 EMAs cluster between roughly $0.57 and $0.61, far above current price.
Momentum indicators back up that weakness. The Money Flow Index is hovering around 16.8, suggesting capital inflows remain thin and conviction is lacking. Meanwhile, the MACD stays negative, with bearish momentum continuing to build. Until these indicators start to shift, rallies may struggle to gain real traction.