
- Ethereum is consolidating near $2,000 after a sharp pullback from the low $3,000s
- A long-term “Expanding Diagonal” count projects a possible $9K–$18K target zone if structure holds
- ETH is tightening into a daily triangle below $2,100, setting up the next major move
Ethereum is still trading around the $2,000 area after a hard drop from the low $3,000s, and the market is clearly trying to catch its breath. Price has stopped free-falling, but it hasn’t exactly reclaimed confidence either. What we’re seeing now is that awkward phase where ETH is stabilizing, yet still looks heavy, like it could snap in either direction.
That tension is showing up on the charts in a pretty obvious way. Short-term candles are tightening, volatility is compressing, and traders are waiting for the next decisive push. Meanwhile, some longer-term analysts are arguing that this pullback may just be part of a larger structure, not the end of the move.
Long-Term Chart Work Tracks a Multi-Year “Expanding Diagonal”
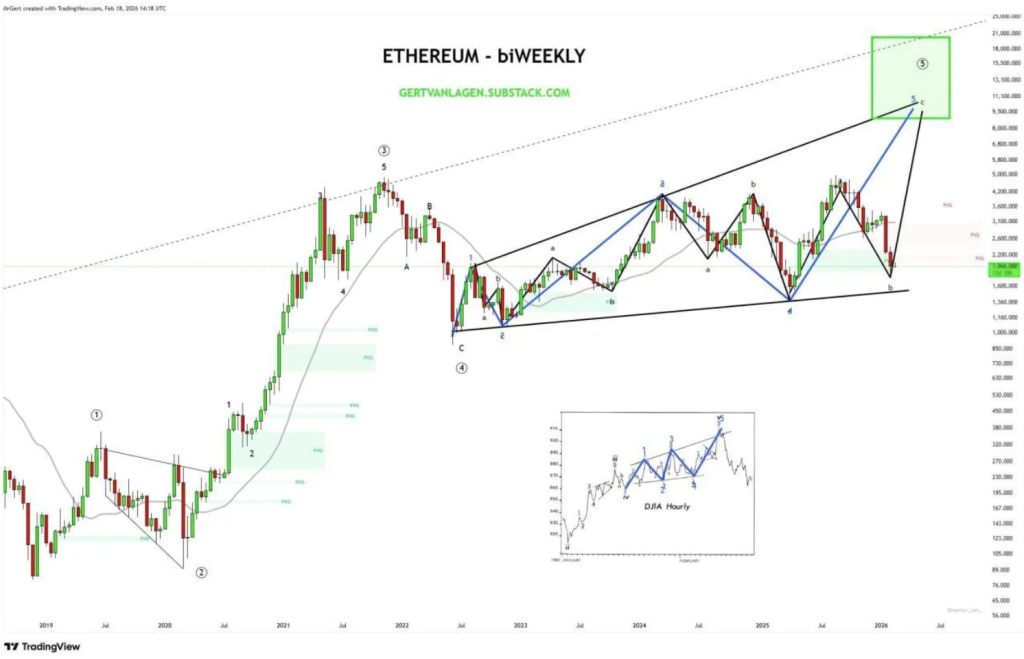
Crypto analyst Gert van Lagen says Ethereum is still following what he describes as a “textbook Expanding Diagonal” on the biweekly chart. In his view, the larger wave ⑤ that started back in 2018 is now entering its late stage, with the subwave labeled ⑤-5-a already having printed an all-time high.
From there, he argues Ethereum moved into the next phase, ⑤-5-b, which extended lower after ETH lost a higher time frame simple moving average. The decline also filled a fair value gap between roughly $1,800 and $2,300, a zone he highlighted as a prior imbalance that needed to be revisited.
According to his count, the final leg higher would be ⑤-5-c, and that’s where the bold targets come in. Van Lagen places the projected zone between $9,000 and $18,000, assuming the structure remains valid. His invalidation point is a break below the level labeled ⑤-4 on his chart, which would essentially kill the count.
ETH Compresses Into a Triangle as Traders Wait for Direction
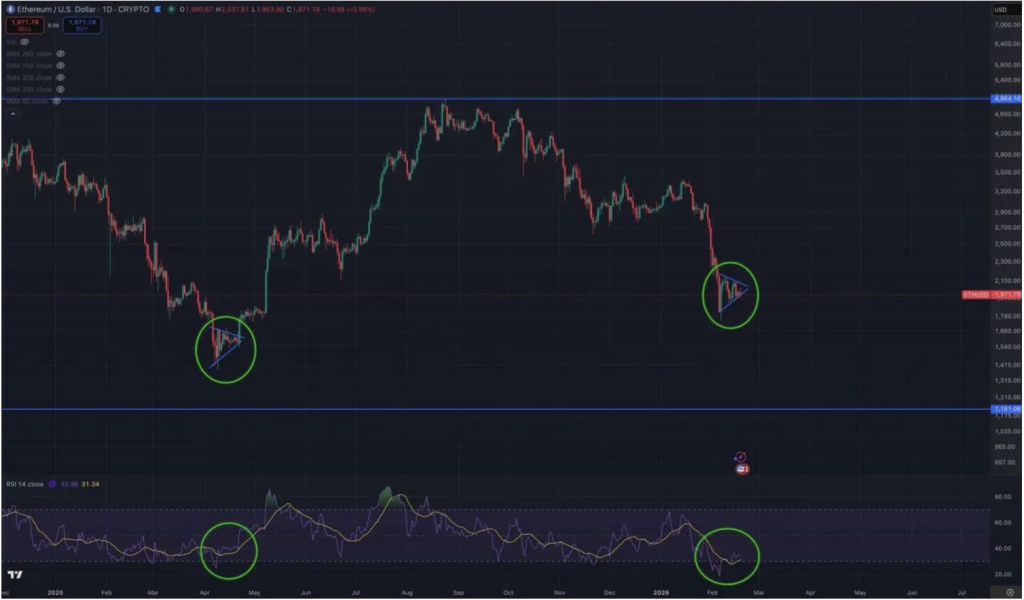
On the daily ETHUSD chart, Ethereum is holding near $1,972 while tightening into a narrow triangle just below the $2,100 region. The shape is classic: lower highs pressing downward and higher lows rising up from the mid-$1,800s. It’s not exciting, but it’s important, because triangles like this often resolve with a strong move once price reaches the apex.
The problem for bulls is that ETH is still stuck under former support around $2,000, which has flipped into resistance. That’s a key psychological and technical level, and it’s acting like a lid right now. Until ETH closes above it cleanly, rallies will keep looking fragile.
Momentum Cools as RSI Recovers From Oversold Levels
Momentum indicators are starting to stabilize, but they aren’t screaming “bull market” either. RSI has been hovering in the lower band and recently bounced slightly from sub-30 readings, which reflects cooling downside pressure. In other words, sellers are not as aggressive as they were during the dump, but buyers aren’t taking over yet.
Price action has also been printing tighter candles as ETH keeps testing the same support zone without breaking it. That repeated defense matters, because it shows the market is finding buyers near the lows. Still, without a breakout, the structure remains unresolved, and the next move will likely decide whether ETH is building a base or just pausing before another leg down.
The Bigger Picture Still Matters
Zooming out, Ethereum remains inside a wide daily range, with historical support marked around $1,150 and resistance near $4,950. ETH is nowhere near the top of that range right now, and that’s why the market still feels cautious. The upside potential is there, but price has to prove it step by step, not through theory.
For now, Ethereum is sitting in a pressure zone. The long-term count suggests the final upside leg may still be ahead, but the short-term triangle will likely decide whether ETH can regain momentum, or if this pullback still has more work to do.