
- BNB is stabilizing inside a key $550–$650 support band that analysts view as a potential reversal zone.
- Price dropped from $750 to $587 and is now consolidating near the $608–$598 Fibonacci support pocket.
- MACD and RSI remain mildly bearish, but weakening histogram pressure suggests sellers may be losing momentum.
BNB might be getting close to one of those turning points traders love to spot early, the kind where price stops bleeding and starts building a base. On Monday, February 16, crypto analyst Crypto GVR suggested that Binance’s native token could be finding strong support in the $550 to $650 region, a zone that may end up acting like a reversal floor if buyers keep defending it.
The bullish argument isn’t only technical either. Supporters point to positive network developments, rising adoption, and improving sentiment as reasons BNB could regain strength over the coming months. Still, it’s crypto, so nothing comes with guarantees. The chart needs to confirm the story, not just hint at it.
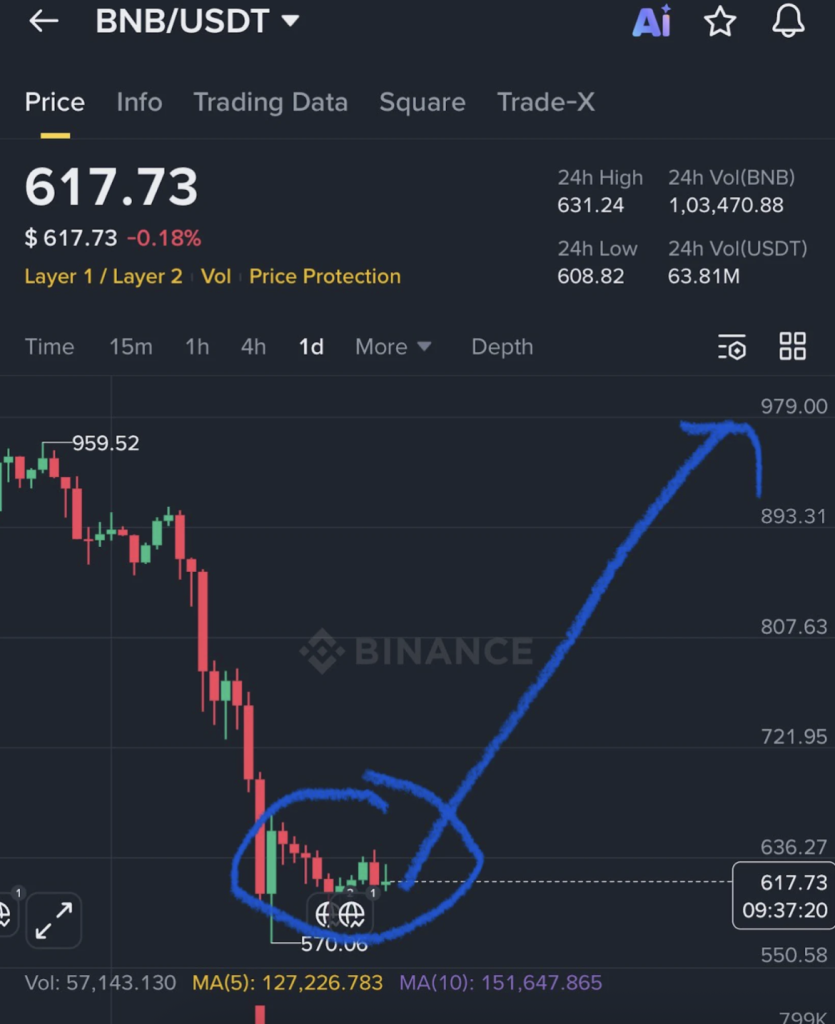
BNB Bulls Are Watching the $550–$650 Support Band
According to Crypto GVR’s view, if BNB holds this support range, the token could eventually rally toward $1,200 to $1,500 within a 3 to 6 month window. That’s an aggressive projection, and it’s clearly based on the assumption that the broader market stabilizes and BNB regains trend strength.
For traders, this setup becomes less about “calling the top” and more about watching confirmation signals. Volume, key resistance breaks, and momentum indicators will matter far more than a single tweet or target range.
Because in a market this volatile, the only thing worse than missing a rally is getting chopped up in the fakeout before it.
BNB Is Consolidating After a Sharp Drop From $750
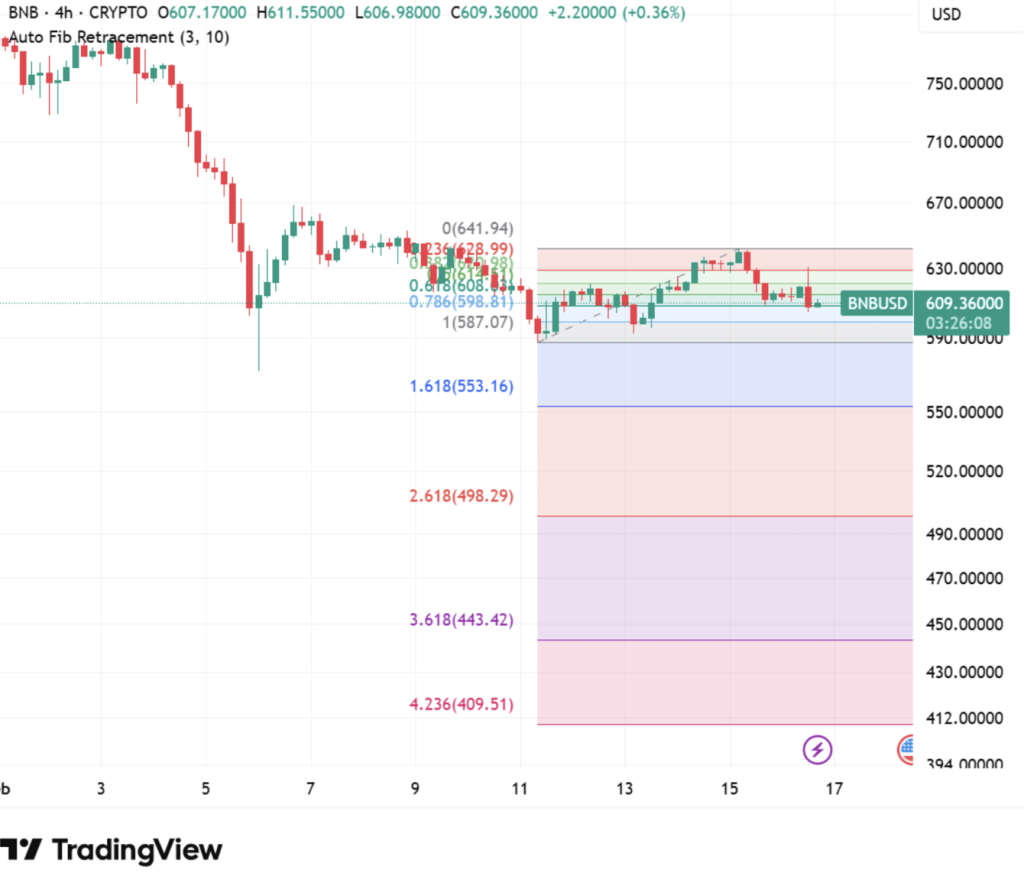
TradingView data shows BNB fell rapidly from around $750 down to roughly $587 before bouncing back into the $610 to $630 zone. That kind of drop usually leaves behind a messy chart, where price has to digest the move before any real trend can rebuild.
Fibonacci retracement levels highlight a few key zones traders are tracking:
- 0.236 near $629
- 0.382 near $621
- 0.618 near $608
- 0.786 near $598
Right now, the 0.618 to 0.786 range is acting as a critical support pocket after the bounce. It’s basically the area where bulls need to hold the line if the rebound is going to remain credible.
If price loses that region, the chart starts opening up downside extension levels. Fibonacci extensions suggest potential targets around $553, $498, $443, and even $410 if support fully breaks. Those are not predictions, but they are the “map” traders use when momentum turns bearish again.
On the upside, the area around $629 has already shown resistance, with price struggling to push through cleanly. That level is now a near-term barrier bulls need to reclaim.
Momentum Indicators Suggest Selling Pressure Is Easing
Momentum indicators aren’t fully bullish yet, but they’re starting to soften. The MACD still shows the blue MACD line below the orange signal line, and both remain under the zero level. That confirms bearish momentum is still technically dominant.
However, the histogram bars have been printing smaller, which usually means the selling pressure is fading. It’s not a reversal signal by itself, but it’s often what happens before the market flips. The fact that both lines are converging near the zero level suggests a crossover could form soon if buying continues.
The RSI is sitting around 43.50, still below the neutral 50 threshold. That points to mild bearish conditions, but it’s not deeply oversold either. Combined with the slight bounce in price, it hints that sellers are losing control, even if bulls haven’t fully taken over yet.
BNB Is in a “Wait for Confirmation” Phase
Right now, BNB looks like it’s consolidating after a heavy drawdown, with traders watching the 0.618 to 0.786 retracement zone for signs of stability. If that support holds and price can reclaim resistance near $629, the bullish reversal narrative starts to strengthen.
If it fails, downside extension levels come back into play quickly.
BNB is not in breakout mode yet. But it’s also not in freefall anymore, and that’s usually the first step toward a real trend shift. The next few sessions will likely decide whether this is the start of a larger recovery, or just another pause before the market tests lower support.