- Solana’s network usage surged, with Active Addresses up 56% and weekly transactions reaching 515 million
- Derivatives data shows buyer dominance, but spot volume has been cooling, raising caution
- Long-term holders continue accumulating, suggesting consolidation rather than immediate breakout
Solana (SOL) has been lighting up on-chain metrics, and the numbers are hard to overlook. Active Addresses jumped 56% in a single week, while weekly transactions climbed to roughly 515 million. That kind of activity usually points to genuine usage, not just short-lived speculation. People are using the network, and that matters more than any single candle on the chart.
This surge in activity arrived alongside a breakout from Solana’s regression channel, reinforcing the idea that demand was building beneath the surface. Derivatives positioning also leaned constructive, with traders appearing more willing to position for upside than downside.
Buyers Take Control as Derivatives Turn Bullish
CryptoQuant data added weight to the bullish case. Both the spot taker CVD and futures CVD flipped into buyer-dominant territory, meaning aggressive market buys outweighed sells over a longer timeframe. When these metrics align, they often reflect sustained demand rather than a brief reaction move.
That said, the short-term environment hasn’t been completely smooth. Bitcoin briefly slipped below its $94.5k local support before bouncing back above $93k, dragging broader sentiment around with it. Solana dipped into the $130–$133 demand zone during that move, an area buyers were actively defending at the time. So while the structure held, the market still showed signs of hesitation.
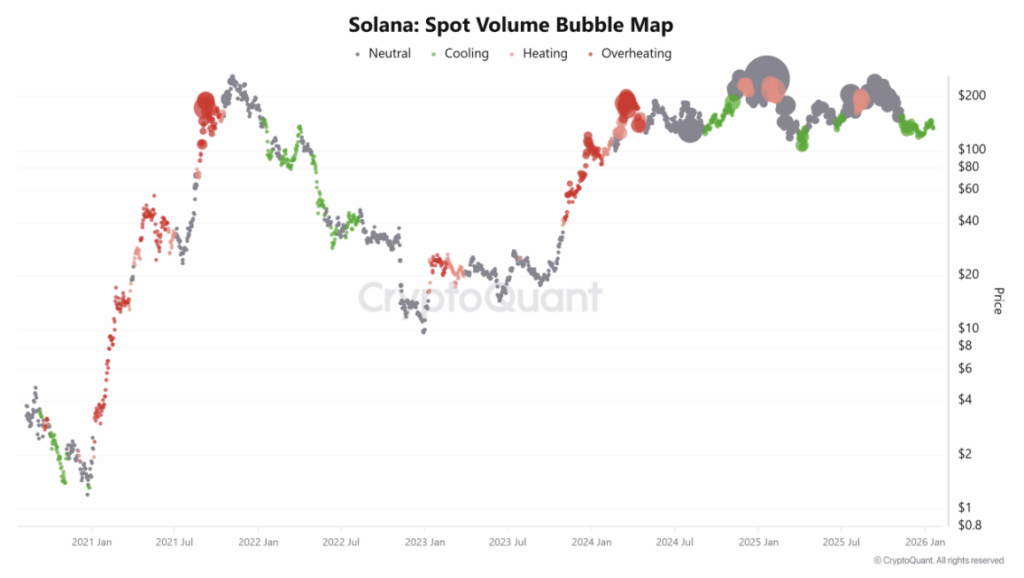
Cooling Spot Volume Raises Questions
One wrinkle in the otherwise positive picture is spot volume. The Solana spot volume bubble map has been showing a steady cooling phase since late November. Green signals on the chart indicate declining volume and slower activity, not overheating.
In strong uptrends, cooling volume can signal consolidation or even a local bottom before continuation. However, this phase looks more like the volume behavior seen in 2022 than the energetic conditions of 2024–2025. Back then, falling volume didn’t precede a rally, it marked a broader shift into weaker market conditions. That similarity has made some traders cautious.
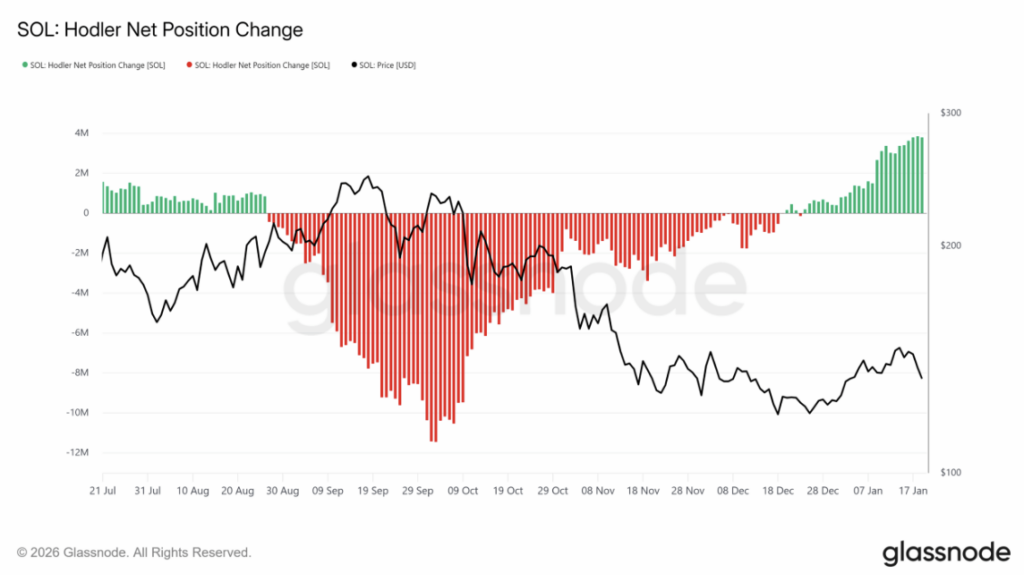
Long-Term Holders Continue to Accumulate
Despite cooling volume, longer-term signals remain supportive. Glassnode’s HODLer Net Position Change has stayed positive since the final week of December, suggesting holders are adding to positions rather than selling. Exchange flow data supports this view as well, with SOL consistently flowing out of exchanges since mid-December.
That pattern points to accumulation, not distribution. Still, accumulation alone doesn’t guarantee an explosive move higher. It often signals patience instead of urgency, especially when broader market conditions are mixed.
What This Means for SOL Going Forward
Taken together, Solana’s setup feels balanced but unresolved. Strong on-chain usage and buyer-dominant derivatives point to real demand, while cooling spot volume tempers expectations for an immediate breakout. This combination may reflect a consolidation phase rather than the start of a sharp trend.
For long-term participants, this could be a period where steady positioning, like dollar-cost averaging, makes more sense than chasing short-term momentum. The next major move will likely depend on whether volume returns alongside usage, or if broader market weakness takes control again.