
- BONK surged 11.5% as volume spiked 157% and Open Interest rose 13.4%, signaling a sharp return of speculation.
- Price broke above its descending channel, flipping short-term structure toward potential reversal territory.
- Exchange outflows remain strong and funding is negative, suggesting quiet accumulation but also crowded shorts that could trigger volatility.
BONK just snapped back to life. The token jumped 11.5% in the last 24 hours to around $0.0000057189, and the move wasn’t subtle. Trading volume surged 157%, market cap pushed up to roughly $632.66M, and speculative appetite clearly returned after weeks of slow bleed.
Derivatives activity also heated up. Open Interest climbed 13.4% to $7.63M, which tells you traders aren’t just buying spot. They’re piling into leverage too. And that’s where things get tricky, because leverage can fuel breakouts… but it can also turn them into violent whipsaws.
Right now, BONK is sitting at a real inflection point. Is this the start of a structural recovery, or just another breakout that gets faded once the leverage unwinds?
BONK Breaks Its Descending Channel and Flips the Short-Term Structure
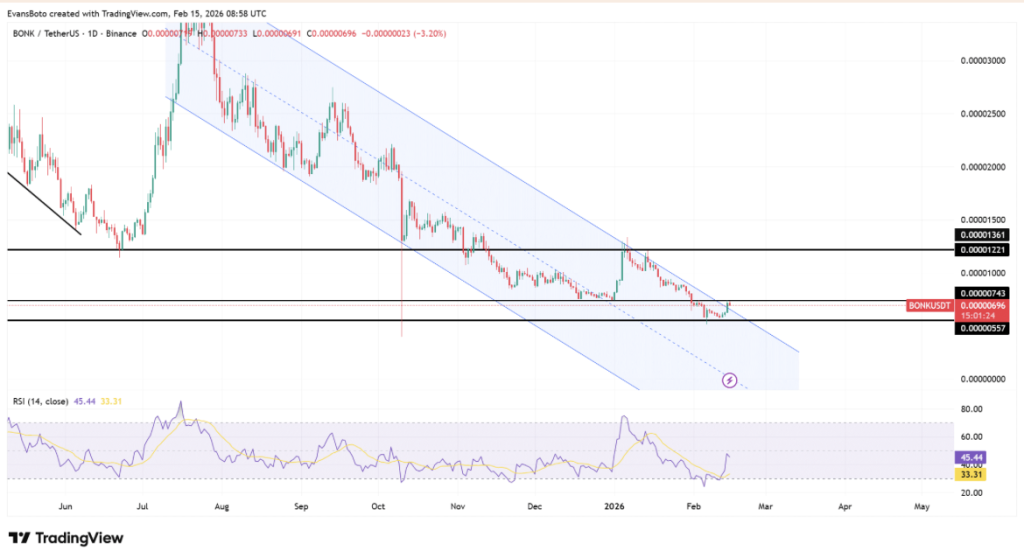
On the daily chart, BONK pushed decisively above the upper boundary of its descending channel. That matters because it changes the structure immediately. This isn’t a bounce that stalled under resistance, it actually cleared the channel wall that had been capping price for a long time.
Price traded around $0.00000696 after reclaiming the $0.00000557 support zone. Now, the next immediate pivot sits at $0.00000743. If bulls can defend that level, the setup opens up toward $0.00001221, where previous supply zones capped rallies in the past. Beyond that, $0.00001361 stands out as the next structural ceiling, the kind of level that tends to trigger heavy profit-taking if price reaches it.
The important detail is this: BONK is no longer trapped inside the same downtrend structure. The technical bias shifts from “downtrend continuation” to “possible reversal territory.” It’s not confirmed yet, but the tone is different.
RSI Is Recovering, But It’s Not Full Bull Mode Yet
Momentum indicators are improving, but they’re not screaming “new bull trend” just yet. The RSI is around 45.44, after rebounding from deeper oversold territory in the low 30s. That’s an early sign of momentum repair, not a breakout into strong upside control.
If RSI pushes above 50, it would be a cleaner confirmation that buyers are taking control again. Still, even this rebound already signals something meaningful: internal pressure is shifting. BONK is no longer compressing downward nonstop. Strength is rebuilding, slowly, under the surface.
Exchange Outflows Suggest Quiet Accumulation
One of the more interesting signals is happening in exchange flows. Spot netflows have remained negative across multiple sessions, with the latest reading showing roughly -$870K leaving exchanges. That means more BONK is being withdrawn from centralized platforms than deposited.
Over the past several weeks, red bars have dominated the inflow/outflow chart. Even during price weakness, traders kept pulling BONK off exchanges instead of sending it in to sell. That’s usually a constructive sign. It reduces immediate sell-side liquidity and can create a tighter supply environment if demand returns.
Outflows alone don’t guarantee a rally, obviously. But it’s very different from panic inflows, which tend to show up right before breakdowns. BONK’s flow profile suggests holders are choosing custody over liquidation, which doesn’t match the idea of aggressive distribution.
Crowded Shorts Are Building, and That Can Get Dangerous Fast
Now for the spicy part.
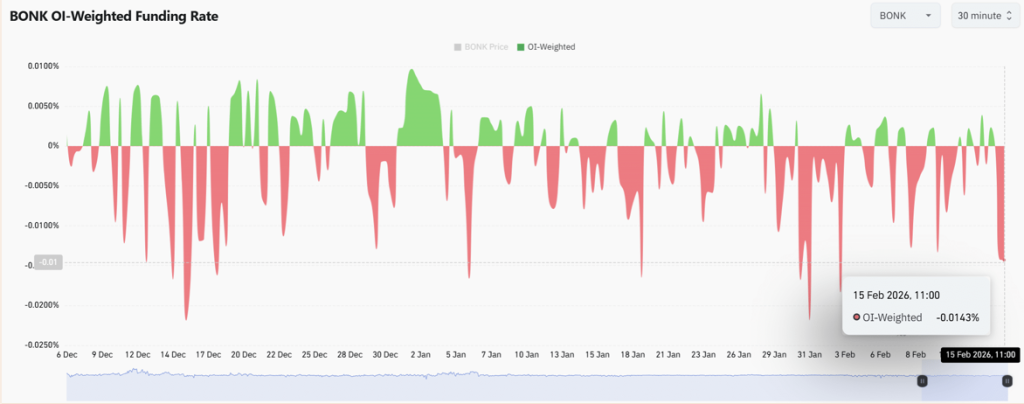
The OI-weighted funding rate printed around -0.0143%, showing a persistent negative bias in the derivatives market. Shorts are paying longs, which means traders are still leaning bearish, even as price structure improves.
At the same time, Open Interest is rising. That combination is important. When funding stays negative while price climbs, it often signals crowded short positioning building into the move. And if price continues pushing higher, those shorts can get squeezed, forcing cover and accelerating upside volatility.
Of course, it cuts both ways. If BONK loses momentum and breaks back below reclaimed levels, those bearish positions get validated, and leverage can unwind quickly. That’s how these meme charts get ugly in a hurry.
BONK Is Bullish on Structure, But Leverage Will Decide the Outcome
To sum it up, BONK has broken its descending channel, RSI is recovering, exchange outflows remain strong, and funding is still negative. Structurally, that leans bullish. But the rising Open Interest and short-heavy derivatives positioning inject serious volatility risk into the setup.
If BONK defends the reclaimed support zone, momentum could extend into the next resistance bands. If it fails, the unwind could be fast, and the market will go right back to chopping people up.
Right now, the technical shift carries weight. But the derivatives crowd will likely decide whether this breakout becomes a real recovery… or just another fakeout.