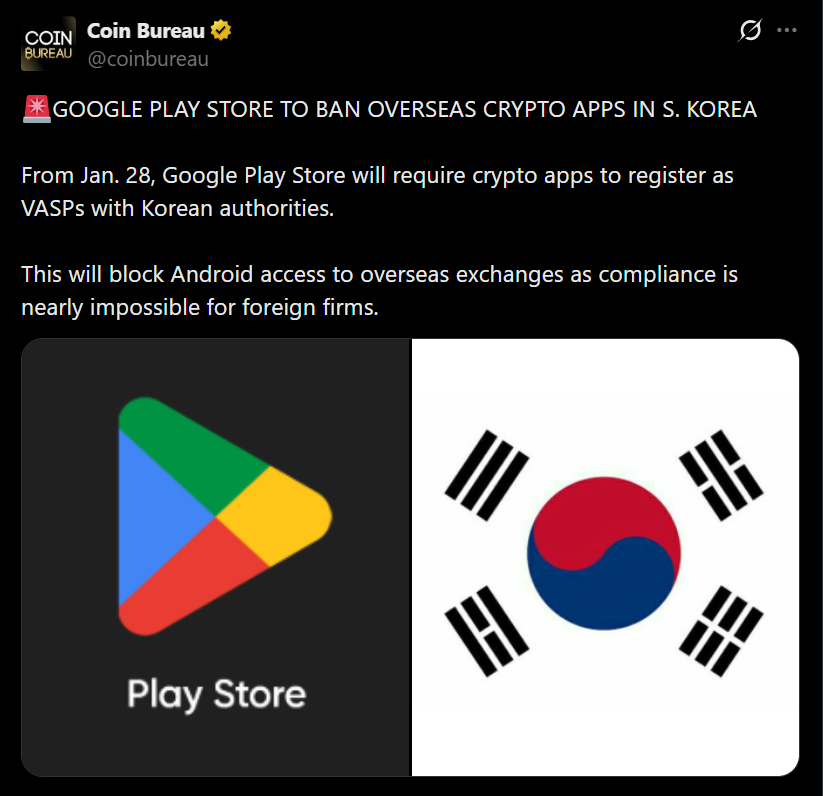
- Google will remove Binance and OKX from Google Play in South Korea starting January 28.
- App store enforcement now acts as a powerful form of de facto regulation.
- The move raises deeper questions about sovereignty and platform control.
It’s a strange moment when you zoom out. A US company that started as a search engine now has the power to decide which crypto apps millions of South Koreans can even access. That reality became clear after Google confirmed it will remove Binance and OKX from Google Play in South Korea starting January 28. No court ruling. No parliamentary debate. Just app store enforcement, executed with a few internal policy decisions.

Regulation Enforced Through Distribution
On paper, this is about compliance. South Korea requires crypto platforms to register with its Financial Intelligence Unit and meet strict AML and security standards. That framework isn’t new, and the rules are well known. What’s changed is how enforcement actually happens. Instead of regulators directly blocking services, access is cut at the distribution layer. When Google Play removes an app, new users can’t download it, existing users miss updates, and security patches stop arriving. For financial products, that’s not a slap on the wrist — it’s a slow shutdown.
Google isn’t writing South Korean law, but it’s executing it with reach that most regulators simply don’t have. Control the app store, and you control the market.
The Korean Crypto Paradox
South Korea is one of the most active crypto markets in the world. Retail traders often rely on offshore platforms for derivatives, yield products, and tools local exchanges don’t offer. At the same time, regulators are tightening oversight and nudging activity back toward licensed domestic players. The paradox is hard to miss. A foreign tech company now acts as the final gatekeeper deciding which global crypto platforms South Koreans can even try to use.
This isn’t really about Binance or OKX specifically. It’s about power. Platform power doesn’t respect borders, and it often moves faster than law.
Why This Should Raise Bigger Questions
The uncomfortable part isn’t that rules are being enforced. It’s who enforces them. When access to an entire national market depends on an app store policy written in California, sovereignty starts to feel thinner than most people assume. Google didn’t pass a law or issue a fine. It simply flipped a switch on distribution.
And that’s the quiet lesson here. In modern finance and technology, control of distribution often outranks regulation itself. Google didn’t just block a few crypto apps in South Korea. It reminded everyone where real leverage lives.