- Solana trades near $120 as ETF inflows remain steady while derivatives traders lean bearish.
- Rising futures Open Interest paired with a higher short ratio suggests growing sell-side pressure.
- SOL must defend $115 support or break above $133 to confirm its next directional move.
Solana is trying to stay on its feet, but it’s not exactly convincing right now. At press time on Tuesday, SOL was hovering just above $120 after slipping nearly 2% the day before. The move comes as SOL-focused ETFs show signs of renewed interest, even after logging their weakest weekly inflow recently. At the same time, derivatives data is flashing a different message, one that leans more cautious, even bearish, as futures activity heats up.
Institutions Keep Accumulating, Retail Turns Defensive
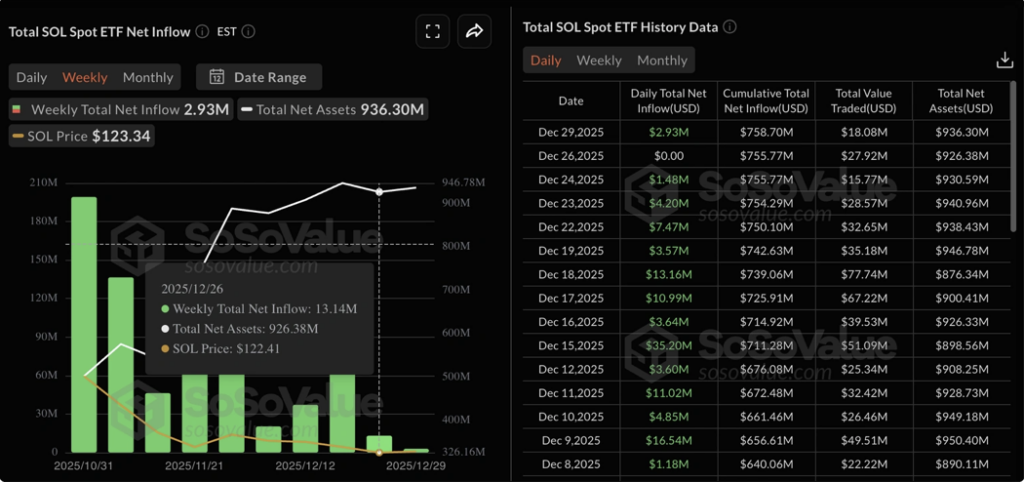
On the institutional side, Solana ETFs brought in about $13.14 million last week, a sharp drop from the $66.55 million seen the week prior. That slowdown hints at softer appetite amid broader market volatility, but it doesn’t tell the whole story. On Monday alone, ETFs still attracted $2.93 million in fresh inflows, following a flat session on Friday. It’s not aggressive buying, but it’s steady, and that matters.
Retail traders, however, appear far less optimistic. CoinGlass data shows SOL futures Open Interest climbing to $7.68 billion, up from $7.54 billion the previous day. Rising OI usually signals fresh capital entering the market, but direction matters. In this case, the long-to-short ratio has tilted bearish, with short positions now making up roughly 52.5% of open trades, up from under 50% just a day earlier. That suggests much of the new money is betting on downside rather than a rebound.
Price Structure Remains Fragile Near $120
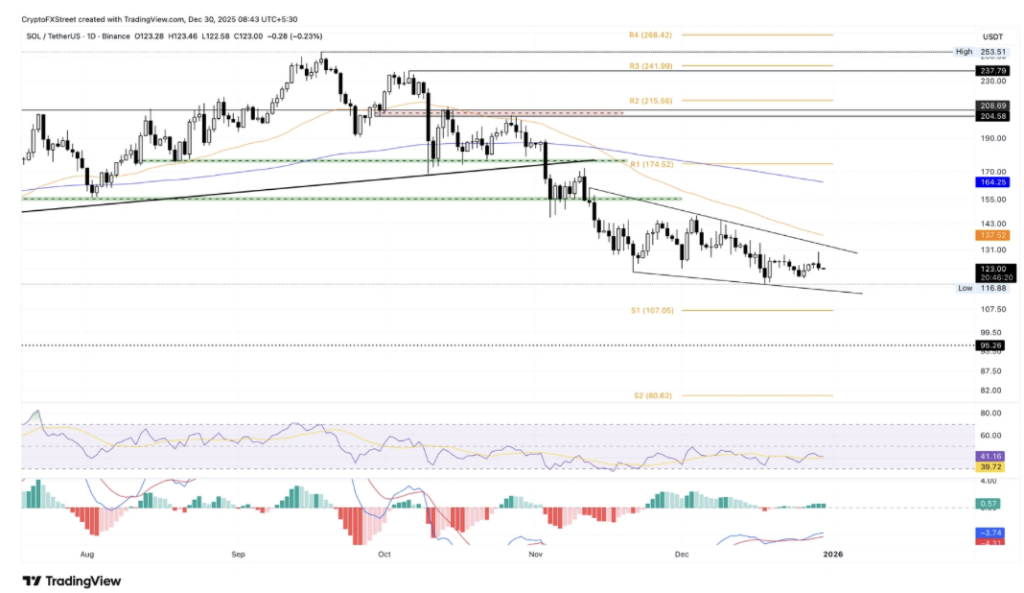
From a technical standpoint, Solana is sitting in a delicate spot. On the daily chart, SOL continues to trade within a descending wedge, shaped by two converging trendlines. Monday’s rejection near $130 sent price lower again, raising the risk of a deeper move toward the lower support trendline, which lines up near $115.
If that level gives way, the next area to watch sits around the S1 Pivot Point near $107. Below that, things get less comfortable, with the April 7 low near $95 acting as the deeper safety net. It’s not the base case yet, but it’s on the map.
Indicators Send Mixed Signals
Momentum indicators aren’t offering a clean answer either. The RSI is hovering around 41, drifting sideways below the neutral 50 level, which points to lingering bearish pressure. Buyers haven’t stepped in with enough force to flip the indicator, at least not yet.
That said, the MACD tells a slightly more hopeful story. It’s bouncing off the signal line and inching back toward the zero level, hinting that bullish momentum could be trying to rebuild under the surface. It’s subtle, not a breakout signal, but enough to keep bulls interested.
Looking higher, SOL would need to break above the descending resistance line, drawn from the November 12 and December 9 highs, around $133. Clearing that could open a run toward the 50-day EMA near $137. Until then, Solana remains stuck between cautious institutions, defensive retail traders, and a chart that hasn’t quite made up its mind.