
- Ethereum is holding key weekly support but has yet to confirm a breakout or breakdown.
- Major resistance above will likely decide ETH’s broader direction heading into 2026.
- Daily charts show ETH stuck in a range, with volatility possibly delayed until next year.
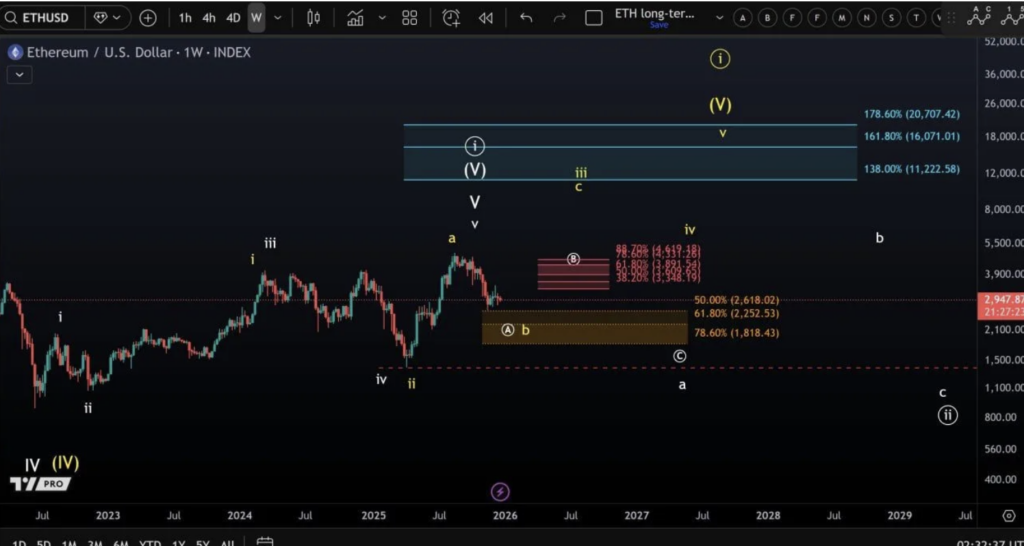
Ethereum has continued to grind sideways, holding weekly support without showing any real urgency to break higher. Price recently hovered near $2,947 on the weekly ETHUSD chart, sitting just above a broader structural support zone highlighted by analysts at More Crypto Online. According to their view, an upside response is still possible from this area, though the market hasn’t ruled out one more dip early next year before choosing a clearer path.
What stands out is the patience in price action. ETH isn’t collapsing, but it isn’t convincing buyers either, and that balance often shows up ahead of bigger decisions. As things stand, Ethereum looks like it’s waiting, maybe longer than traders would like.
Weekly Structure Sets the Stage for 2026
On the higher timeframe, Ethereum is resting above a layered support band marked around $2,618, $2,252, and $1,818. These levels line up with key Fibonacci references and have historically acted as areas where downside momentum slows. For now, they remain intact, which keeps the broader structure from turning outright bearish.
Above price, however, sits a dense resistance zone stretching roughly from $3,348 to $4,619. This cluster is seen as the first major hurdle ETH would need to reclaim to shift the long-term setup. Analysts note that how price behaves once it reaches that zone, if it does, will likely determine which larger scenario takes control heading into 2026.
Analysts Say the Market Hasn’t Chosen Yet
More Crypto Online emphasized that neither bullish nor bearish scenarios have been invalidated at this stage. Instead of forcing a directional call, the current structure simply outlines conditions that could guide the next move. Probabilities, they argue, will only shift once price confirms behavior at these major zones, not before.
In other words, Ethereum hasn’t made its decision yet. And until it does, expectations need to stay flexible, even if that’s uncomfortable for short-term traders.
Ethereum Remains Range-Bound on the Daily Chart
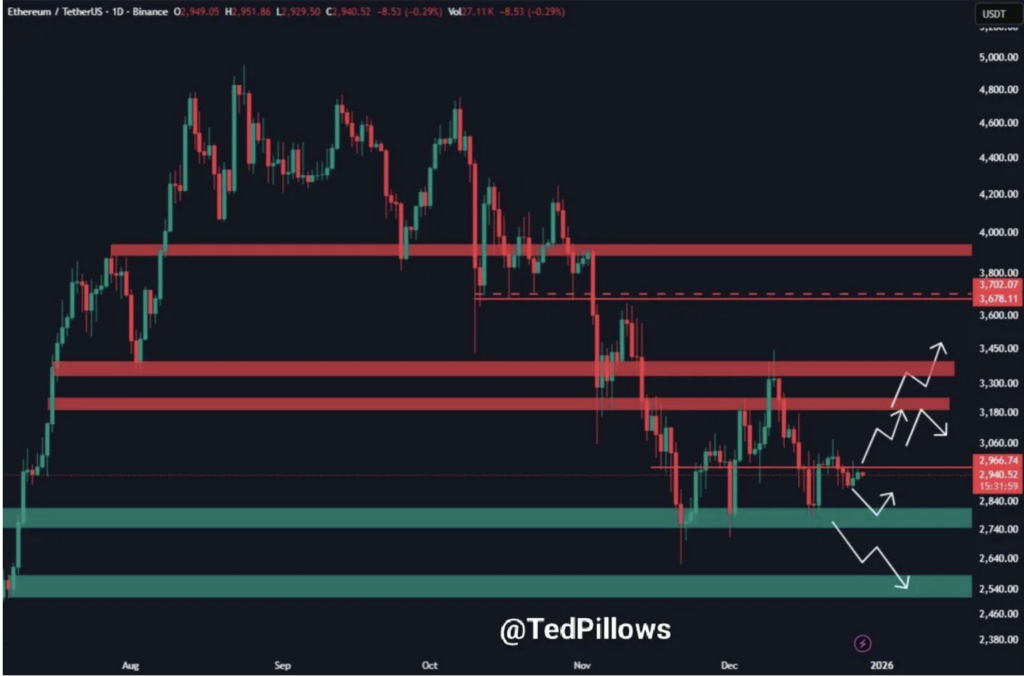
That hesitation shows up clearly on the daily timeframe too. Analyst Ted Pillows pointed out that ETH has gone almost nowhere recently, hovering around the $2,940 area on the ETH/USDT chart. Attempts to reclaim higher resistance have stalled, keeping price locked inside a familiar range.
The chart shows multiple overhead supply zones, with resistance clustered in the low $3,000s and another band closer to the mid $3,000s. Below, a green support zone stretches toward the upper $2,000s, marking the downside area traders watch if the range finally breaks.
Volatility May Wait Until 2026
Ted Pillows described Ethereum as “stuck in a range,” suggesting that meaningful volatility may not arrive until 2026 begins. The setup maps out several possible paths, including a push into resistance, a pullback to support, or continued sideways drift, as long as price remains trapped between these zones.
For now, Ethereum appears content to consolidate. The bigger move may still be ahead, but patience, once again, is the price of admission.