- Aave’s SEC investigation officially ended, removing a major long-term risk, but price action barely reacted
- Falling open interest and weak momentum suggest traders are still stepping back in the short term
- AAVE remains technically fragile below key resistance, with downside levels still in play
Aave (AAVE) is still sliding, and the chart isn’t hiding it. At the time of writing on Wednesday, the token was trading below $186 after another clean rejection from a well-defined resistance zone. Despite a major regulatory cloud finally lifting, short-term price action tells a different story, one where bearish pressure is still very much in control.
SEC investigation ends, but price barely reacts
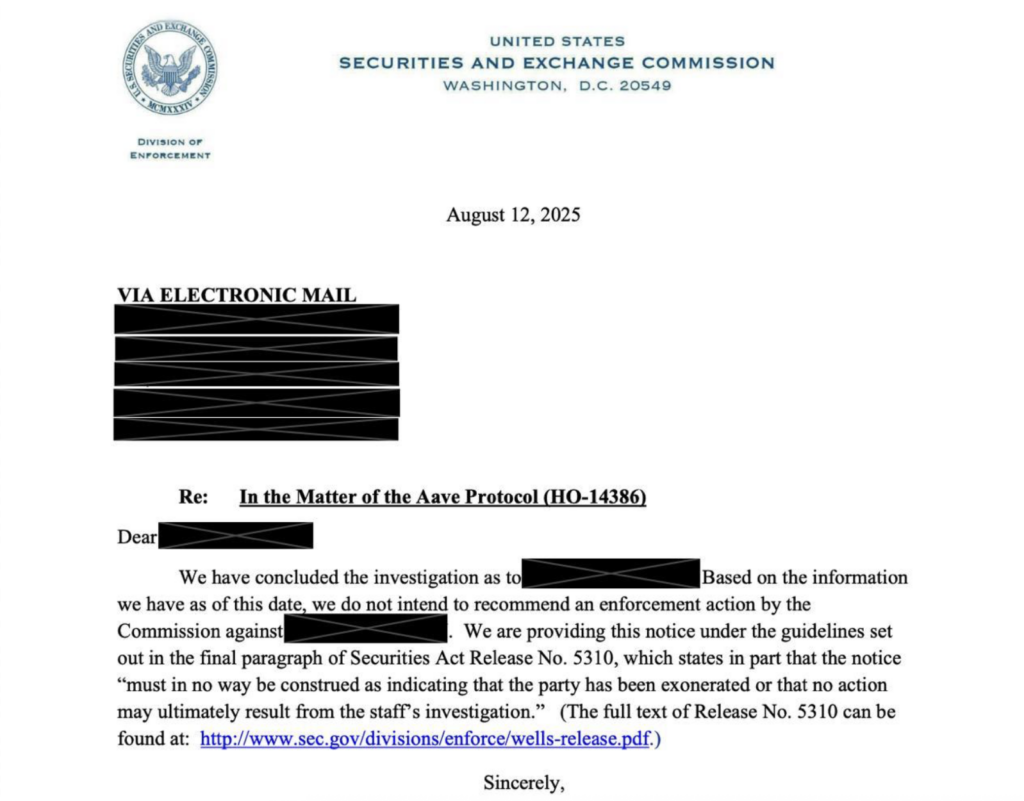
Earlier this week, Aave founder and CEO Stani Kulechov confirmed that the U.S. Securities and Exchange Commission has officially closed its four-year investigation into the Aave protocol. He described the outcome as a turning point, noting that DeFi has operated under heavy regulatory scrutiny for years and that this chapter can now finally close.
From a long-term perspective, this is a clear win. The removal of regulatory uncertainty improves investor confidence and gives the protocol more freedom to focus on product development and adoption. Still, the market shrugged. On the day of the announcement, AAVE fell another 3.48%, a reminder that relief narratives don’t always translate into immediate price strength, especially in risk-off conditions.
Derivatives data keeps flashing caution
Zooming into derivatives, the tone remains defensive. Open interest for AAVE on Binance has dropped to roughly $56.6 million, hovering near yearly lows. That decline suggests traders are exiting positions rather than opening new ones, a classic sign that speculative appetite is cooling.
When open interest falls alongside price, it usually means conviction is fading. There’s no aggressive dip-buying showing up yet, and that lack of leverage support keeps downward pressure intact.
Technical structure favors sellers, for now
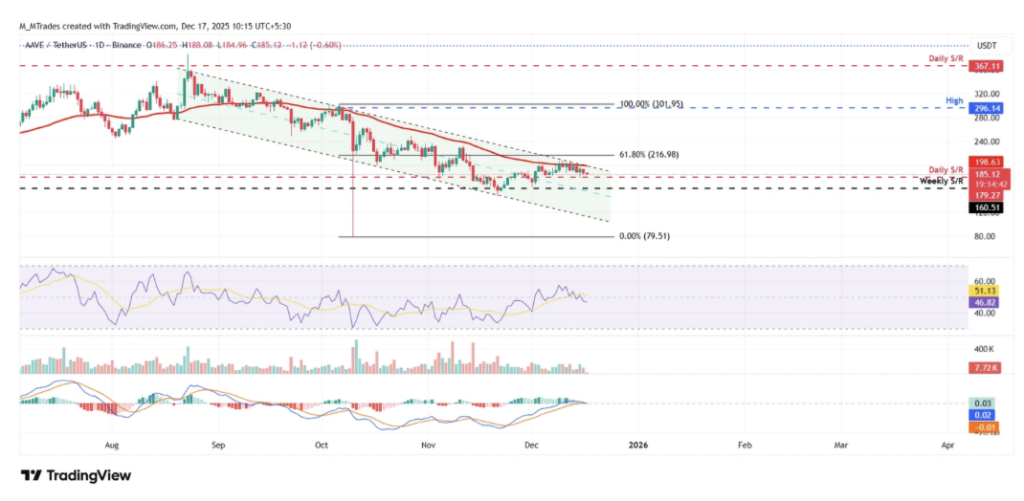
Technically, AAVE ran into trouble earlier this month after failing to reclaim its 50-day exponential moving average near $198.64. That level also aligns with the upper boundary of a falling channel, making it a tough ceiling. Since that rejection on December 10, price has slipped roughly 8%, settling near $185.
Momentum indicators are starting to lean bearish. The RSI sits around 47, below neutral, hinting that sellers are gradually gaining control. Meanwhile, the MACD lines are tightening and edging closer to a bearish crossover. If that flip confirms, it would add more weight to the downside case.
If weakness persists, the next level to watch sits near $179. A daily close below that opens the door to a deeper move toward the weekly support around $160. On the upside, bulls would need a decisive push back above the 50-day EMA near $198 to shift the short-term structure.
For now, the regulatory victory is real, but the chart is still asking for patience.