
- LTC drops 9% but volume surges 158%, signaling heavy trader activity.
- Litecoin holds key multi-year support between $72–$75, with upside targets at $88–$110.
- RSI and MACD lean bearish, with potential breakdown levels at $66 and $54–$58.
Litecoin is slipping again — and this time the drop comes with a surprising surge in trading volume. Over the last 24 hours, LTC has fallen roughly 9.65%, and the weekly chart doesn’t look much better with a 12.14% decline. Selling pressure is heavy, steady, and showing almost no signs of easing. Still, traders are clearly active: LTC is trading around $75.89, and its 24-hour volume has exploded to $711.87 million, a massive 158% jump. Even with the sell-off, Litecoin’s market cap is holding near $5.81 billion, signaling that volatility is sparking participation rather than silence.
Litecoin Holds the Line at a Multi-Year Trend Support
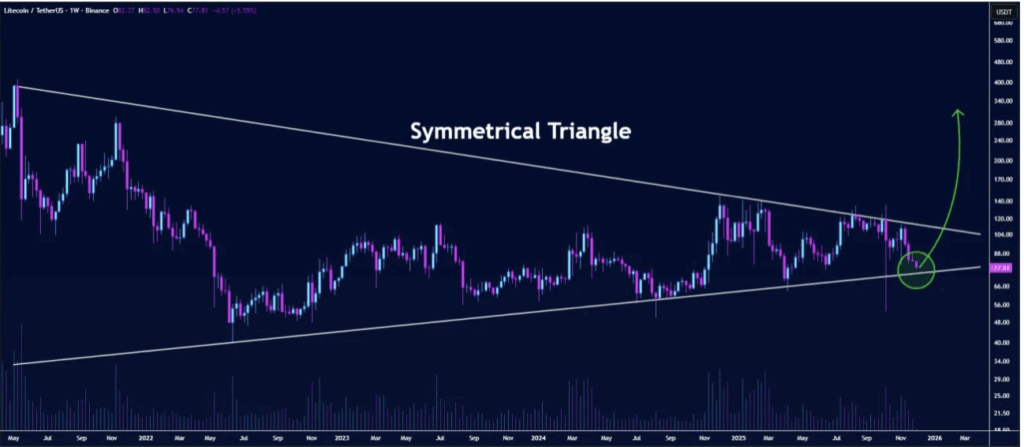
Right now, Litecoin is sitting directly on a multi-year trendline inside a large symmetrical triangle — a structure that has played a huge role in past cycles. The region between $72 and $75 has historically acted as a strong buy zone, a place where whales and long-term supporters tend to step in. Volume staying controlled during this pullback hints at what traders call an “accumulation phase,” even though price action looks painful in the short term.
Crypto analyst @butterfly_chart pointed out that if LTC rebounds from this area, the first upside targets sit around $88–$90. Further resistance levels cluster near $104 and $110. A breakout above the descending side of the triangle could spark a much wider rally — potentially toward $180, with a long-term target resting somewhere between $200 and $250.
But — and it’s a big “but” — the breakdown scenario still matters. A weekly close below $70 would weaken the entire multi-year structure and confirm the loss of that trendline support. In that bearish case, LTC may drop toward $66, and eventually to the $54–$58 zone if selling pressure snowballs. Until that breakdown happens, though, the broader structure still leans toward a possible upside reversal.
Momentum Indicators Lean Bearish, but Oversold Signals Are Growing
Litecoin’s momentum indicators are painting a cautious, slightly gloomy picture. The RSI currently sits at 38.05, well below its moving average of 49.04, confirming rising selling pressure and weak buying strength. The formation of lower highs adds to this bearish weight, showing that buyers aren’t rushing in yet.
On the MACD side, the reading is -4.04081, sitting just above the signal line at -4.05323 — extremely close, but still negative. The histogram sits at -0.01242, with red bars reflecting strengthening downward momentum. The sell side is still firmly in control for now, even though some oversold signals are beginning to show.
Outlook
Litecoin is sitting on a critical level where either a strong rebound or a deeper breakdown can occur. The technical structure still favors a possible upside as long as the multi-year trendline holds, but momentum indicators suggest sellers haven’t let go just yet.
Here is where the next move could determine whether LTC is preparing for an eventual breakout… or slipping into a longer correction.