- SUI drops 70% from ATH, falling to $1.66 as forced selling intensifies.
- Analysts mark $1.7–$1 as a potential long-term accumulation zone.
- Key reversal depends on reclaiming $1.71 and holding the long-term trendline.
Sui has taken a heavy beating lately, sliding all the way down to $1.66 after a brutal 70% drop from its all-time high of $5.35. The move has triggered a wave of attention from analysts who are spotting early signs of forced liquidations, panic exits, and what looks like a full positioning reset. Volume has quietly been ticking up while price sinks into crucial territory — the kind of combination that sometimes hints at early accumulation, although it’s still too soon to call anything a bottom.
Analysts Eye the $1.7–$1 Range as a Possible Accumulation Zone
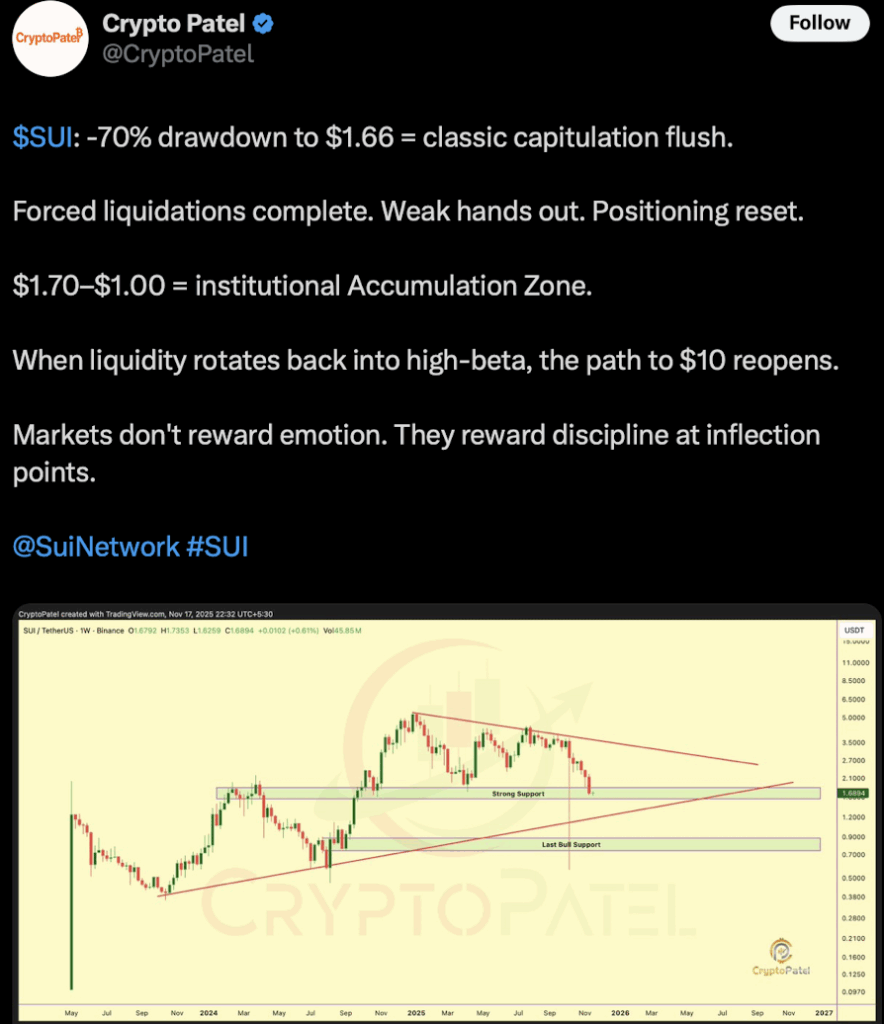
Crypto Patel called the recent dump a “classic capitulation flush,” saying the $1.7 to $1.0 band might become an institutional buy zone if the market stabilizes. “Forced liquidations complete. Weak hands out. Positioning reset,” he wrote — basically suggesting that the worst of the shakeout may be behind us. Patel added that if broader liquidity shifts, SUI could eventually reclaim higher levels. For now, SUI is testing support around $1.65. Lose that, and the next real zone doesn’t show up until $1–$0.9. These levels held in previous cycles, so traders are watching them like hawks.
Downtrend Still Dominant as SUI Approaches Long-Term Trendline
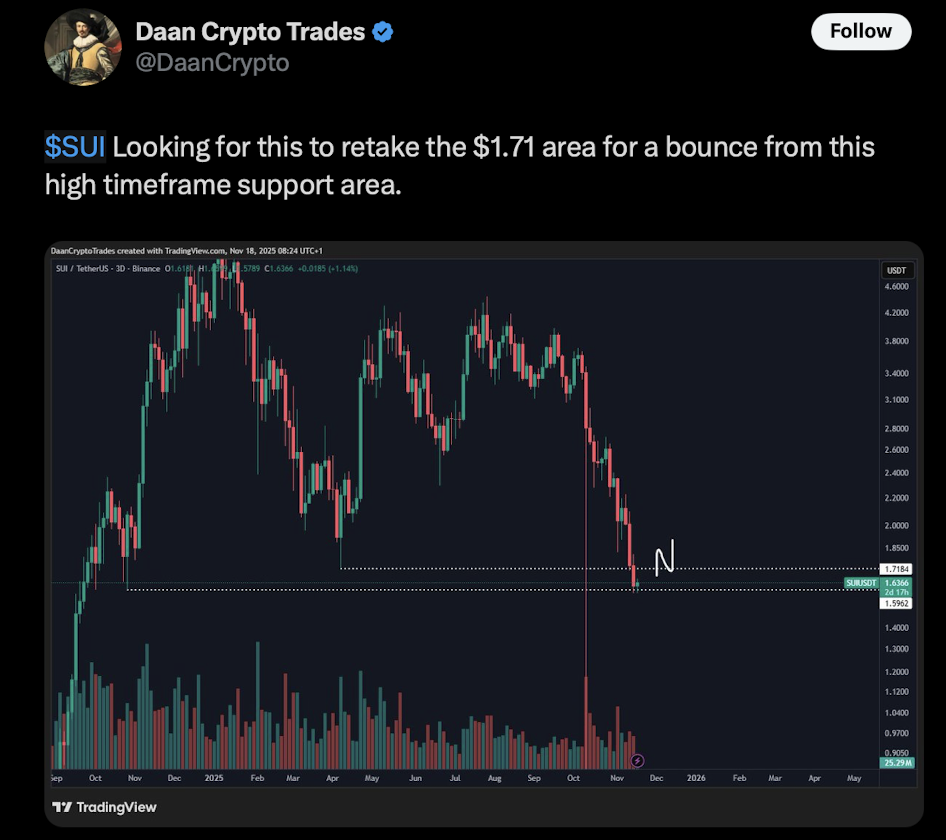
The broader structure for Sui isn’t pretty. Lower highs have been forming since early 2025, and the downtrend hasn’t broken once. Analyst Daan Crypto Trades pointed to $1.71 as the main horizontal level SUI needs to reclaim before any kind of bounce becomes believable: “Looking for this to retake the $1.71 area,” he posted. Interestingly, SUI is now brushing against the lower boundary of a long-term trend channel — the same place where it once launched a massive 1,000% run. Retesting the line could spark another rebound… but a breakdown below it would flip the entire structure bearish.
Indicators Show Weakness, but Also Early Reversal Conditions
The weekly RSI sits at 35, just above oversold territory. That means buyers are still weak, but it also signals that SUI is creeping into a zone where past reversals have started to take shape. The MACD, though, is still firmly bearish. The crossover hasn’t reversed, and the red histogram bars keep growing — a sign that downside momentum is still very much alive. Taken together, the signals say the trend hasn’t turned yet. It could, but it absolutely needs confirmation from price and momentum before anyone calls it a recovery.
Ecosystem Activity Still Alive Despite Price Pressure
Even as the token struggles, the Sui ecosystem isn’t standing still. Bluefin, a DEX on Sui, recorded record-breaking volume in October. Grayscale rolled out new investment products tied to Sui-related projects. And as reported recently, Sui partnered with Figure Technology to launch YLDS — a token backed by short-term U.S. Treasurys and repo agreements. So while SUI’s price chart looks battered, the underlying ecosystem isn’t collapsing. Whether that foundation is enough to spark a trend reversal depends on how price reacts to these final support levels.