- TRON’s TRX has shown relative strength, trending higher toward $0.30 while many altcoins stay choppy and Bitcoin fails to reclaim higher levels.
- On the daily chart, a close above roughly $0.298 would mark a bullish structure shift, while lower timeframes already show strong buying pressure and an uptrend, as long as $0.296 holds as support.
- Liquidity clusters near $0.303 and $0.328 suggest TRX could be drawn toward those levels soon, but bulls must overcome these resistances with solid volume to sustain a true uptrend.
TRON has been moving in its own lane lately, quietly grinding higher while a lot of other altcoins chop around without direction.
Why TRON is catching traders’ attention right now
While most popular altcoins have been stuck in messy volatility, TRON’s native token TRX has been trying to build a cleaner bullish trend. Price has been pushing toward and attempting to break past the psychological $0.30 level, which naturally pulls in the attention of traders looking for relative strength plays.
Despite broader uncertainty, TRX has managed to trend higher over the past few days, even as Bitcoin [BTC] tried and failed to reclaim the $108k area. That contrast alone makes it interesting: when a coin moves up while the market leader stalls, it often signals that there’s focused demand or rotation into that asset. For traders, that kind of divergence tends to act like a magnet.
TRX daily chart: structure close to flipping bullish
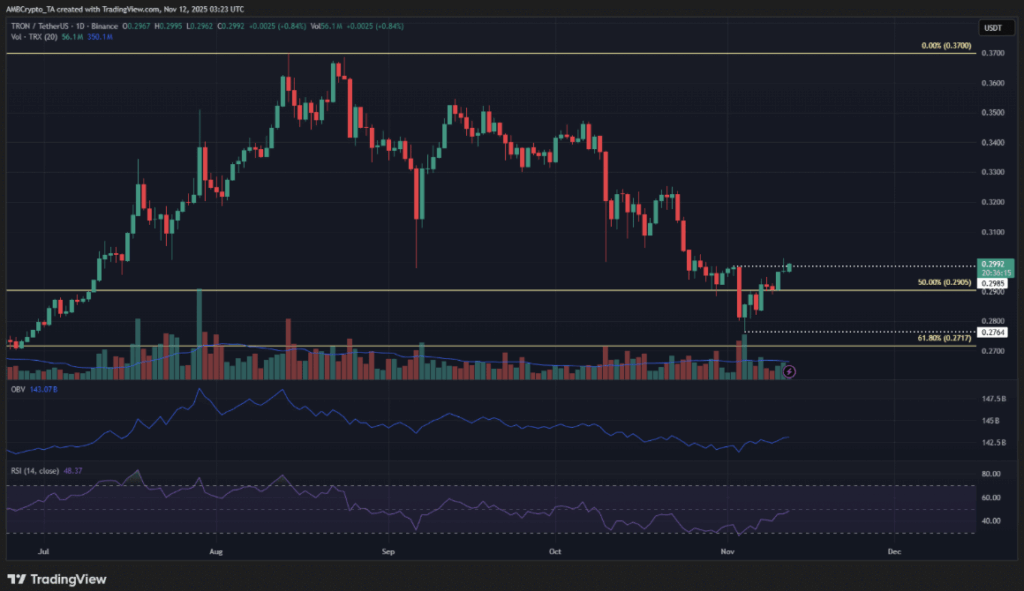
On the 1-day timeframe, TRON looks like it’s sitting right on the edge of a potential structure shift. Since the final week of August, TRX has been stuck in a pattern of lower highs and lower lows, which is classic downtrend behavior. The recent action, however, is pressing against that pattern.
Key recent swing points have been sitting around $0.276 and $0.298, highlighted as important reference levels. At the time of writing, TRX is trading near $0.299, which means price is hovering just above the most recent low of the downtrend. A daily close above roughly $0.298 would mark a clean bullish break of that structure. The attempt to lock this in on Tuesday fell short, with only the candle wick poking above that area, but no decisive close. That leaves the door open for Wednesday to provide that confirmation, if buyers can follow through.
On the indicator side, the On-Balance Volume (OBV) has been creeping higher in recent days, showing that there has been more buying than selling overall. Still, it hasn’t yet broken above the previous lower highs from the last leg down, so the volume picture is improving but not fully convincing. The daily Relative Strength Index (RSI) is telling a similar story: it’s leaning toward bullish momentum but hasn’t firmly established it yet. You could say TRX is “almost there,” but not quite fully flipped.
Lower timeframes point to stronger bullish momentum
Zooming into the 1-hour chart, the picture looks more energetic. Here, both the OBV and RSI paint a much clearer bullish narrative. Over the past week, they’ve signaled strong buying pressure and steady upward momentum, which lines up with the visible uptrend on this timeframe.
Price recently broke above the $0.29 area, which had been acting as a local resistance, and then came back to retest that zone as support — a classic bullish pattern. A brief dip down to around $0.296 actually set up a decent buying opportunity for short-term traders, since it tagged an important near-term support without breaking it. However, the $0.30 region has been stubborn, acting as a key resistance band over the last week. For a convincing breakout, TRX really needs to clear this area on strong trading volume. If price breaks below $0.296 again, that would start to invalidate the bullish short-term idea and suggest the move was more of a fake-out.
Liquidity clusters and upside targets for TRX
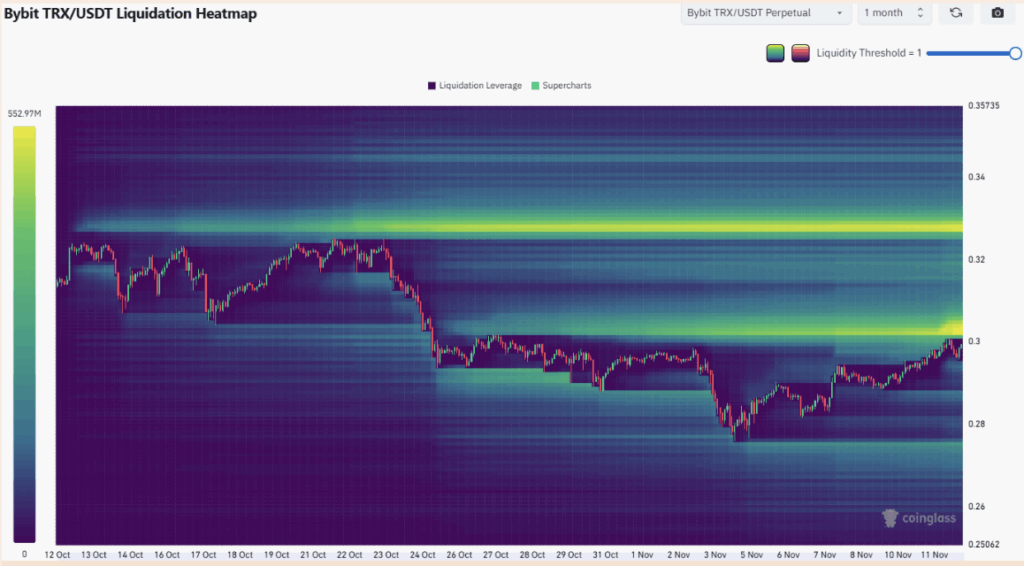
Looking at the liquidation heatmap, the $0.303 and $0.328 zones stand out as nearby liquidity clusters. These are areas where a lot of leveraged positions may get triggered, which often pulls price toward them like gravity in the short term. Because of this, a bounce or push from current levels up into the $0.303–$0.328 range seems quite plausible if buyers maintain pressure.
If TRX can break through $0.303 with momentum, the path toward $0.328 becomes much more realistic in the coming days. That $0.328 level could act as a bigger decision point for the trend: either it rejects there and cools off, or a strong breakout through it could encourage even more traders to pile in. For now, the main threats facing TRX bulls are simple but important — the $0.303 and $0.328 resistance zones, and the need for sustained buying pressure to confirm that this is not just a temporary bounce, but the start of a more durable uptrend.