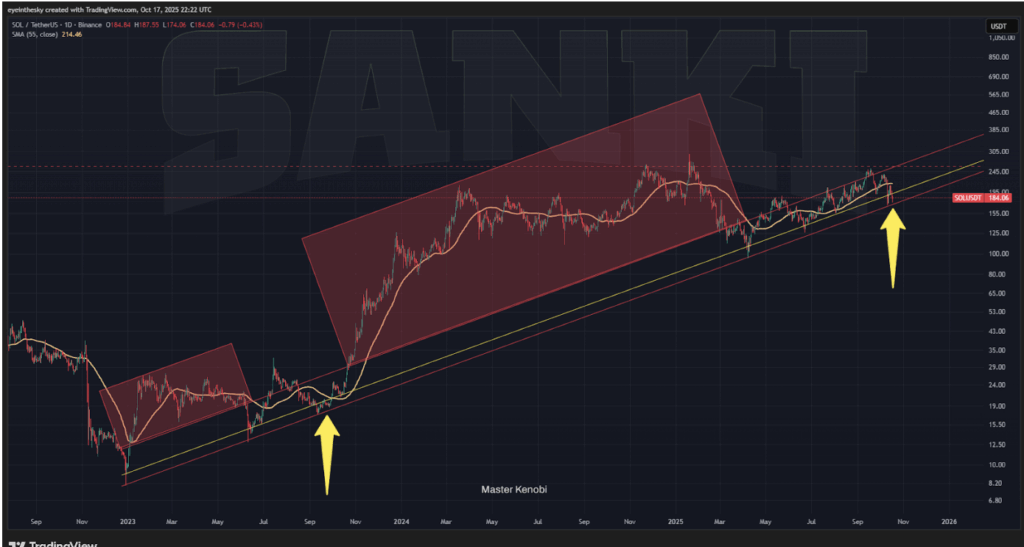
- Solana revisits the lower boundary of a 3-year ascending trend channel.
- 20-week EMA at $193 acts as key resistance, 50-week EMA near $177 as major support.
- Analysts see similarities to last year’s setup, hinting at possible rebound potential.
Solana’s price has been catching a lot of eyes lately after sliding back to the lower boundary of its long-term ascending trend channel — one that’s been in play for almost three years.
Market watcher Master Kenobi pointed out that Solana has now touched this baseline six different times since 2023, and every single touch so far has marked a solid accumulation zone — moments when the price stabilizes before switching direction. Whether history repeats itself again… that’s what traders are watching closely.
Last week, Solana opened near $197, climbed up to $211, and then sharply reversed to $174 before closing around $186.51. That’s roughly a 5.5% weekly loss, but the long lower wick on the candle shows something interesting — buyers are stepping in at the bottom, scooping up coins whenever price dips too far.
Market Mood and Price Structure
The current setup paints a mixed picture. Sellers are clearly active near the highs, but buyers are still defending key levels like $177–$180, suggesting the broader trend remains alive. In fact, the rebound looks eerily similar to what Solana did in September last year — right before its major Q4 rally. Some analysts are hinting that a repeat might not be too far-fetched.
Solana’s pattern still fits within its long-term uptrend, though short-term sentiment has turned slightly cautious. It’s more of a “cooling phase” than a collapse.
Technical Outlook: Correction or Setup?
From a technical perspective, Solana is sitting in a mildly bearish short-term phase, mostly because the 20-week EMA, now around $193, is acting as resistance. Traders are watching this line closely — it’s the level that needs to flip for the next leg upward.
Beneath that, the 50-week EMA near $177 remains critical support. A weekly close above it keeps the medium-term trend intact. But if Solana slips below this level, the next downside targets come into play — the 100-week EMAaround $153 and the 200-week EMA closer to $121. Those are major zones where buyers could step back in if things get shaky.
As for indicators, the RSI sits at 49.6, showing neutral momentum, while the MACD is still positive but gradually softening. That combination typically signals a cooling-off period — more consolidation than a trend reversal.
Competition Rising, Solana at a Crossroads
Solana’s inability to retest its early 2025 highs adds a bit of pressure, especially with BNB and XRP pushing harder for market share. BNB, in particular, has been outperforming lately — another sign that competition among Layer-1s is heating up again.
Still, Solana’s overall chart remains constructive. As long as price stays above that 50-week EMA, bulls have reason to stay optimistic. A clean weekly close above $193 could reignite momentum toward $211, and possibly higher if volume confirms. On the other hand, a break below $177 would suggest a deeper corrective wave, likely testing $150 before any meaningful recovery.
For now, Solana sits right on the edge — quiet, tense, and waiting for the next decisive move.