
- ASTER jumped 12% in a day, but whales sold $12M worth of tokens while smart money trimmed holdings by 5%.
- Exchange reserves climbed sharply, hinting that more selling pressure could be coming.
- Despite the short-term bounce, technical charts and weak momentum suggest the rally might not last.
Aster’s price popped 12% in the past 24 hours, grabbing traders’ attention — but behind the scenes, the story looks less cheerful. On-chain data shows that big players, the so-called “whales” and smart money wallets, have been offloading their bags. The token might be up for the day, but it’s still down more than 20% for the week, and some signs suggest this bounce could just be a temporary detour before more pressure builds.
Whales and Smart Money Are Trimming Down
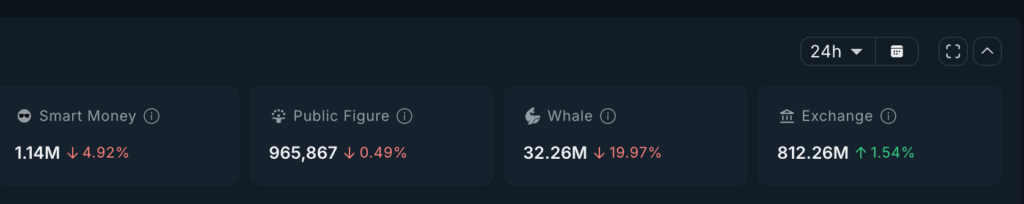
Data from on-chain trackers shows that whales holding over 10 million ASTER have sold nearly 8 million tokens in the past week — worth roughly $12 million at current prices. That’s not small change. Moves like this usually mean confidence is fading among the big wallets, at least in the short term.
Smart money addresses — those that tend to buy early and sell smart — also cut exposure by around 5%, about 59,000 ASTER in total. Meanwhile, exchange balances have jumped by 12.3 million tokens in just one day, suggesting investors are moving their holdings to trading platforms, often a prelude to… yeah, more selling.
Retail Still Not Buying the Dip
Retail traders don’t seem convinced either. The Money Flow Index (MFI) is slipping, showing weak buying interest even after the price pump. It’s like no one’s rushing to “buy the dip” this time. TradingView data points to falling MFI readings, hinting that the crowd might be waiting on the sidelines until the trend looks clearer.
Analysts say this kind of across-the-board selling — from whales, smart money, and retail all at once — isn’t something you see every day. It paints a picture of overall caution, not confidence. Everyone’s kind of bracing, not betting.
Chart Setup Still Looks Bearish
Technically, ASTER is sitting inside a descending triangle pattern on the 4-hour chart — a structure that often leans bearish. Support levels are stacked around $1.30, $1.15, and $0.98. If the price slips below those zones, the next leg down could get rough.
To flip sentiment, bulls need to push and close above $1.59. That’s the level that could break the triangle and open the door toward $1.72 or even $2.02. But without strong volume or momentum, the market isn’t convinced yet.
Momentum Still Weak
The RSI shows a hidden bearish divergence — prices are making lower highs while RSI creeps up. That usually means the bounce isn’t backed by enough real buying strength. If that trend continues, the next move might not be up.
So yeah, while ASTER’s 12% jump looks good at first glance, the underlying signals tell a different story. Whales are selling, smart money’s trimming, and retail’s still skeptical. Until ASTER reclaims and holds above $1.59, this rally might just be another short-lived relief pump.