
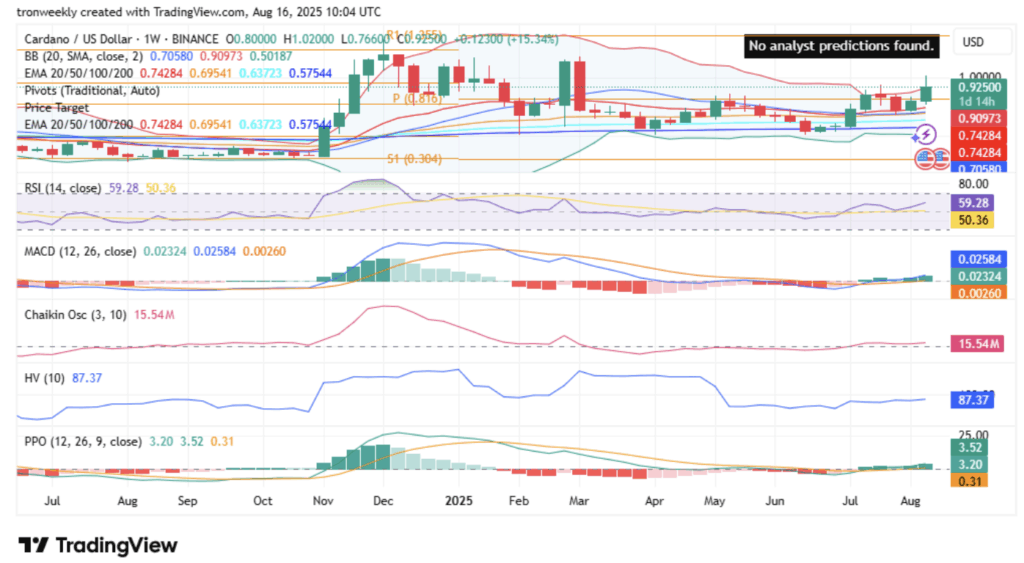
- ADA is trading just under $1, pressing resistance after reclaiming $0.90 and holding above key moving averages.
- Momentum indicators like RSI (59) and MACD remain bullish, with steady inflows showing accumulation.
- A weekly close above $1 could trigger targets at $1.11, $1.20–$1.25, and even $1.30+, while failure risks a pullback to $0.82–$0.86.
Cardano (ADA) is hanging out just under the big psychological wall at $1, trading around $0.9198 at the time of writing. The $0.93–$1.00 zone has been stubborn, but ADA is pressing hard, sitting above its 20-week EMA at $0.743 and even nudging the top Bollinger Band near $0.909. That setup usually signals strong demand trying to push higher.
The weekly Bollinger Bands are stretching wider, which tends to hint at a bigger move ahead. The midline rests down at $0.705, while the top is up near $0.909. If this expansion keeps rolling, technical projections point toward $1.11 as the next likely target. Traders are laser-focused on whether ADA can actually close a week above $1, which would basically confirm buyers are running the show.
Momentum Indicators Still Favor the Bulls
Momentum paints a similar picture. All the big moving averages—20, 50, 100, and 200 weeks—are trending upward, with ADA comfortably trading above each one. That makes $0.74 the key first line of support if things cool off.
RSI is sitting at 59, a healthy level showing strength but not yet overheated. The MACD is positive and still widening, backing the bullish case. Even the Percentage Price Oscillator histogram has flipped green, and Chaikin Money Flow shows around $15 million flowing into ADA each week—proof that accumulation is happening steadily.
Still, volatility sits at 87, meaning traders shouldn’t get too comfortable. Big swings can come out of nowhere, so position sizing becomes critical in this type of setup.
Targets and Possible Scenarios
If ADA can punch through and hold above $1, analysts see $1.11 as the next stop, followed by ranges at $1.20–$1.25, and eventually $1.30–$1.35. There’s about a 60% probability that this continuation plays out. But if price slips back below $0.90 after breaching higher, the bullish outlook weakens fast.
A pullback scenario could also come into play if ADA stalls around $0.95–$1.00. In that case, traders may look for support between $0.82 and $0.86 before another attempt higher. As long as RSI stays over 50 and MACD remains green, the broader uptrend doesn’t break.
The bearish case? Analysts give it only about a 15% chance. That would require ADA to fall under the 20-week EMA at $0.74. A drop under $0.70 would basically confirm trend weakness and open the door to $0.65–$0.60 levels.