
- Cardano (ADA) is trading at $0.80 after a 2.7% pullback, following a 37% surge in July driven by Grayscale’s spot ADA ETF application.
- Technical indicators remain mostly bullish, with strong support at $0.74 and major resistance at $0.94, which could lead to a breakout toward $1.00.
- Trading volume is high, and aggressive traders see the current level as a good entry point, while conservative investors may wait for a dip near $0.74–$0.75.
Cardano’s ADA is cooling off a bit after a wild run earlier this week. The price is hovering around $0.80, down roughly 2.7% in the past 24 hours, as traders lock in profits from the surge sparked by Grayscale’s spot ADA ETF application on July 22.
Despite this dip, ADA’s 15.7% jump earlier in the week broke past the $0.85 resistance for the first time in months. July’s 37% monthly surge has completely flipped ADA’s technical picture—most major moving averages are finally pointing bullish again, which is a big shift compared to the choppy price action seen earlier this year.
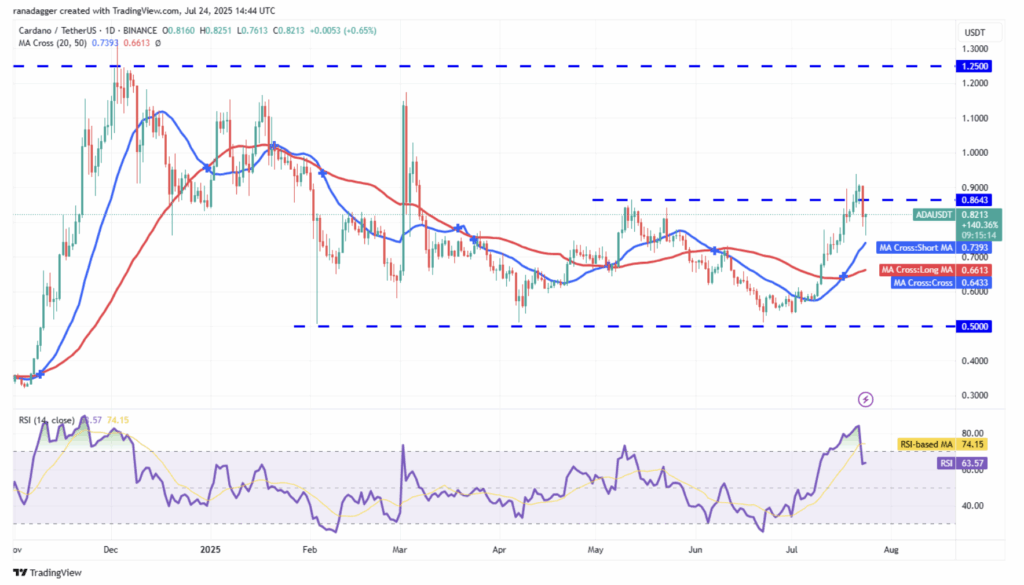
Technical Signals Show Mixed Momentum
Cardano’s RSI is currently sitting at 60, which is kind of neutral territory—neither overbought nor oversold. That means there’s still room to move higher if buyers step in. On the MACD side, things still look pretty bullish, with the main line holding above the signal line and a positive histogram, even after today’s minor pullback.
ADA is trading above its 20-day SMA ($0.75) and well above the 50-day SMA ($0.66). The 12-period EMA is right at the current price, while the 26-period EMA is offering support around $0.74. Bollinger Bands show ADA has plenty of space to move up, with the upper band at $0.94 being the next major target.
Trading volume is still strong—around $242 million on Binance alone—showing that both retail and institutional interest hasn’t faded since the ETF buzz hit.
Key Levels to Watch
Immediate support for ADA is at $0.74, where the 26-EMA is sitting. If that fails, the next solid support is around $0.57, which lines up with the breakout levels from early July. On the flip side, resistance remains at $0.94—a level ADA has already tested but failed to break earlier this week. A clean break above that zone could send ADA toward the psychological $1.00 mark.
However, if ADA slides under the 20-day SMA, the breakout above $0.86 could turn out to be a bull trap. The 50-day SMA around $0.66 would then be the next downside target. Bears are trying to stage a comeback on the 4-hour chart, with moving averages close to a bearish crossover.
Trading Strategy Going Forward
For aggressive traders, the current price near $0.80 might be a sweet spot. Setting stop-losses just below $0.74 keeps the risk low (around 7.5%), while the upside to $0.94 offers nearly 17% profit potential. Conservative investors, though, may wait for a pullback into the $0.74–$0.75 zone, which sits near the 20-day SMA for a cleaner entry.
Cardano’s daily ATR of $0.06 suggests we could see 7–8% swings in either direction, so risk management is key here. If ADA holds these levels and breaks $0.94 soon, the next leg of the rally could be even stronger.