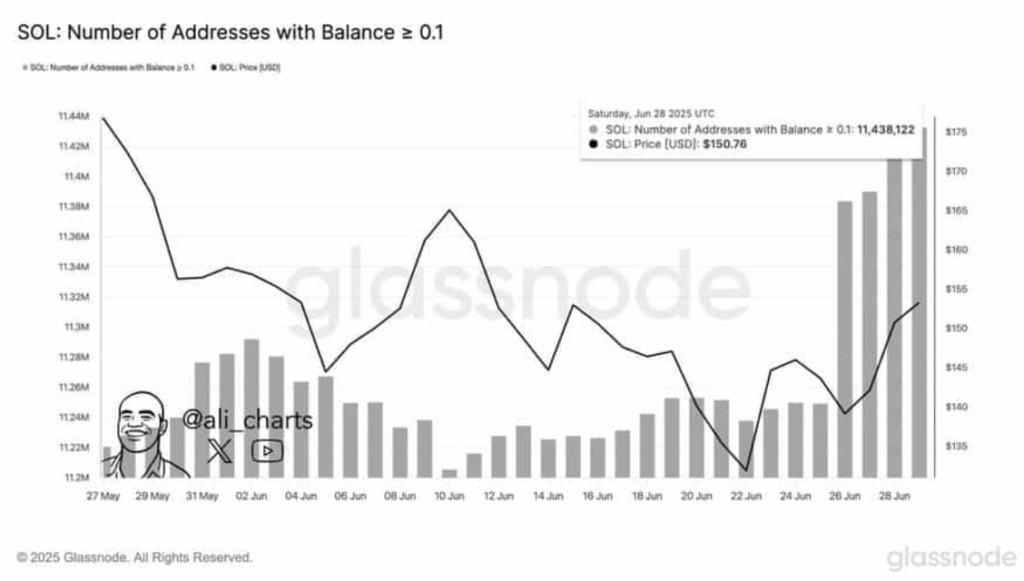
- SOL wallet count hit a record 11.44M, showing small-holder growth.
- Exchange outflows and derivatives volume suggest increasing bullish momentum.
- A breakout above key resistance could push SOL toward $244 in the medium term.
Solana (SOL) slipped about 2.6% on July 1st, trimming back some of the gains it had stacked up over the past week. But zoom out just a bit, and the dip doesn’t look all that worrying. In fact, if you dig into the metrics… things might be heating up.
For starters, wallet activity has been off the charts—literally. Plus, with more tokens flowing out of exchanges and into long-term hands, the stage might be getting set for something much larger.
Wallet Activity Hits Peak — What’s the Deal?
According to Glassnode, the number of wallets holding at least 0.1 SOL jumped to a record 11.44 million on June 28th. That little stat lined up pretty closely with SOL touching $150.76. Coincidence? Maybe not.
It shows more and more smaller investors are quietly stacking SOL. And when that many folks are adding to their bags, it typically says one thing: confidence.
Meanwhile, CoinGlass data showed centralized exchanges saw outflows of $525.3 million by July 1st. If those outflows keep climbing, we could be staring down the barrel of a supply squeeze. Less supply on exchanges, more in wallets—that’s a classic setup for upward pressure.
Derivatives Data Says Bulls Aren’t Done Yet
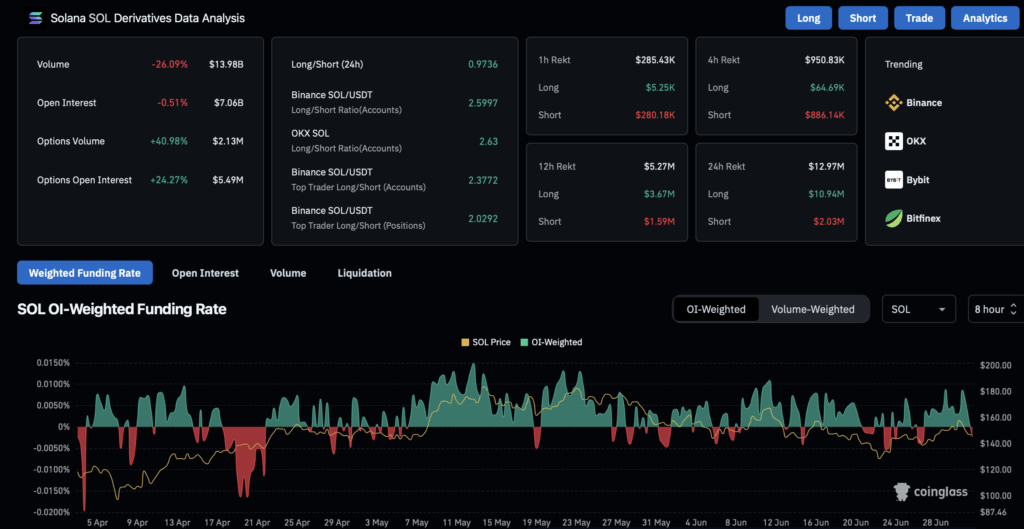
It’s not just the spot market seeing action. Futures and options traders are showing their cards—and right now, they’re holding pretty bullish hands.
Futures volume spiked nearly 89% to hit $20.2 billion, and Open Interest rose over 4%, now sitting at $7.22 billion. Options markets weren’t quiet either—volume up 37%, and Open Interest climbed nearly 18%.
And that Taker Buy/Sell Ratio? Yeah, it’s leaning heavily on the buy side. Overall, the market sits around 1.0012, but Binance and OKX are showing way stronger bullish bias at 1.98 and 2.16 respectively. That’s not just optimism—that’s commitment.
Price Action Shows Bullish Structure, But Resistance Is in the Way
So what’s price saying? According to AMBCrypto’s chart analysis, SOL is trading inside a bullish triangle and has managed to crack the first layer of resistance. That’s a solid first step—momentum just needs to hold.
If SOL can bounce off support at either $144.87 or $139.88, we could see a retest of the $184.88 range. That’s a 27% move from current levels… not too shabby.
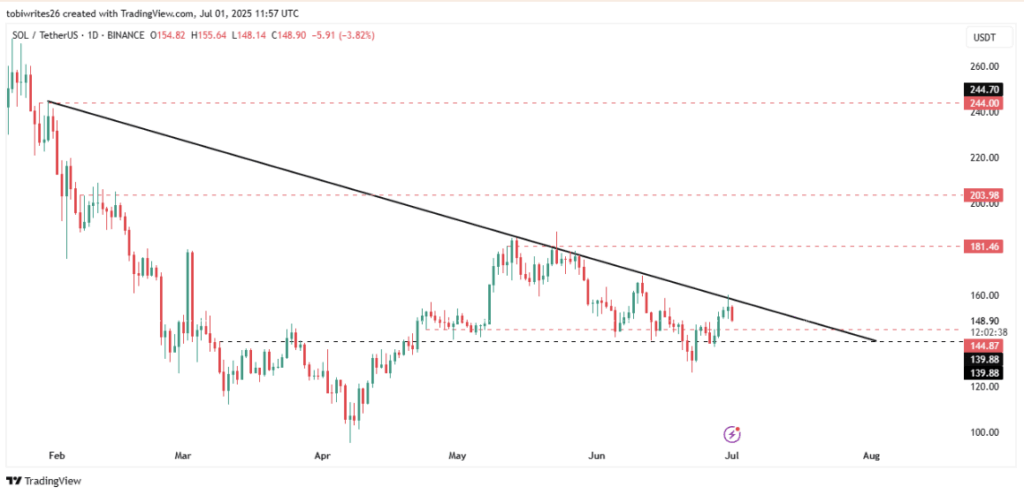
In the medium term, SOL’s still stuck under a descending resistance line. A break above that, though? That’s when things could really start moving. Targets in sight are $181.46, $203.98, and maybe even $244.00 if bulls stay hungry.
Bottom line? Despite the dip, the numbers say the bullish setup is still very much alive. Accumulation’s high, investor confidence is firm, and if SOL can punch through that next ceiling, things might move fast.