
- Short-Term Bullish Momentum: DOT has reclaimed the $3.85 level and is approaching the $4.00 resistance. A successful breakout above this could signal a bullish reversal, with potential targets at $4.44 and $4.76 .
- Technical Indicators Show Mixed Signals: While the 4-hour chart indicates a bullish structure with higher highs and lows, the daily chart’s Awesome Oscillator remains below zero, and the A/D indicator is flat, suggesting caution among traders.
- Key Support and Resistance Levels: Immediate resistance lies at $4.18 and $4.44, with major resistance at $4.76. On the downside, support is found at $3.70 and $3.58. A drop below these levels could invalidate the bullish setup .
Polkadot (DOT) is showing signs of a potential breakout as it approaches key resistance levels, with technical indicators suggesting a bullish momentum building up.
Daily Chart: Approaching Critical Resistance
On the daily timeframe, DOT is nearing the $4.18 resistance level. A successful close above this level could signal a bullish breakout, potentially targeting the $4.44 and $4.76 resistance zones. However, indicators like the Awesome Oscillator remain below the zero line, and the Directional Movement Index (DMI) shows both +DI and -DI below 20, indicating a lack of strong trend direction.
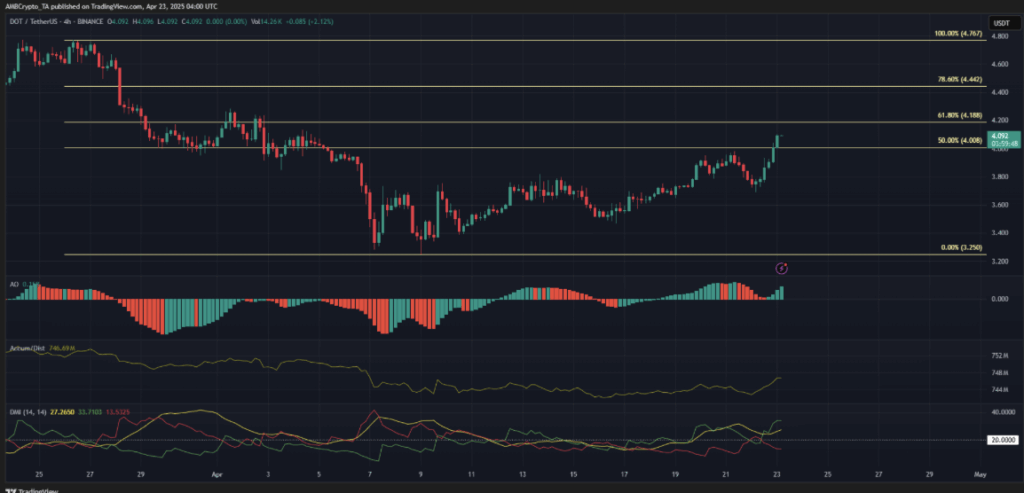
4-Hour Chart: Bullish Momentum Building
Zooming into the 4-hour chart, DOT has been forming higher highs and higher lows over the past two weeks, indicating a bullish structure. The DMI reflects a strong uptrend in progress, and the Accumulation/Distribution (A/D) line’s uptick hints at increased demand for Polkadot.
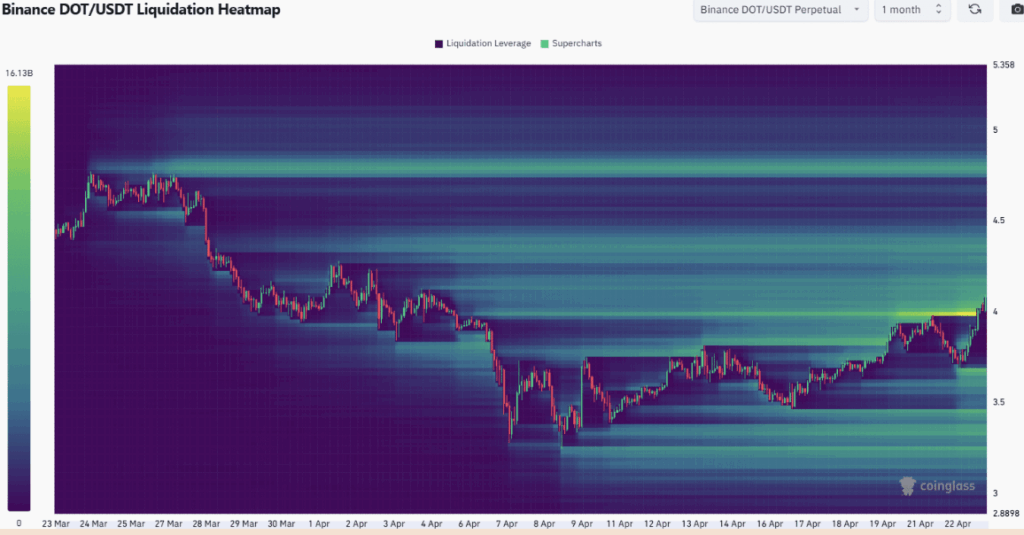
Liquidation Heatmap: Potential Reversal Zones
The liquidation heatmap highlights the $4.00–$4.18 and $4.30–$4.40 regions as areas with significant trading activity.These zones could act as magnets for the price, pulling DOT higher. However, they also pose risks of bearish reversals if the price fails to break through convincingly.
Trading Strategy: Key Levels to Watch
- Immediate Resistance: $4.18 and $4.44
- Major Resistance: $4.76
- Support Levels: $3.80 and $3.60
Traders should monitor these levels closely. A breakout above $4.44, followed by a retest, could provide a strong entry point for long positions. Conversely, a drop below $3.80 might indicate a return to the previous range, warranting caution.