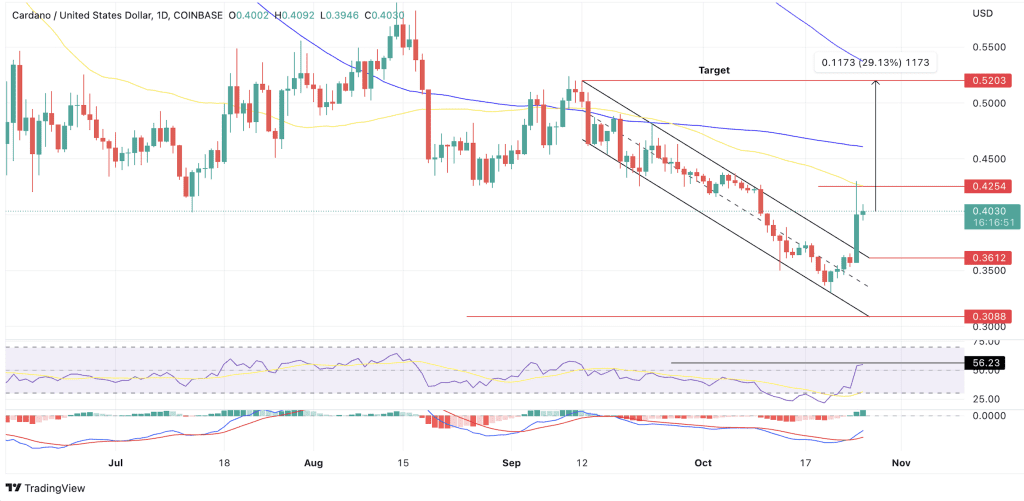
Cardano (ADA) has risen 12% in the past 24 hours to trade above $0.40. Over the last six weeks, ADA has been sealed in a downtrend, dropping more than 36% toward $0.33. At the time of writing, Cardano’s price was trading at $0.403 after escaping from a bearish technical pattern.
Data from CoinMarketCap revealed that the intelligent contracts token was ranked the 8th largest crypto with a market capitalization of $13.73 billion. ADA’s daily trading volume stood at $1,377,601,449 after rising more than 280% daily, which explains why the altcoin has been performing well over the last couple of days.
If the current bullish momentum is sustained, the ADA price may continue rising in a massive recovery that may push the asset significantly higher.
Cardano Price Analysis: ADA Bulls Eye $0.52
Since dropping from highs above $0.52 on September 10, ADA price has been locked in a downtrend forming a series of lower highs and lower lows. This price action led to the appearance of a descending parallel channel, as shown on the daily chart.
This is a significantly bearish technical pattern that paints doom for the altcoin, with the target being the channel’s lower boundary.
However, on Tuesday, the ADA price escaped from the falling channel with a solid and long green daily candlestick on October 25, rising to brush shoulders with $0.43. This makes ADA the second-best performing top-cap crypto over the last 24 hours after rising approximately 12% on the day. Ethereum is the best-performing asset among the top 10 cryptos, with daily gains of 12.5%.
Crypto prices moved in tandem with U.S. stocks, bolstered by a weakening dollar, which recorded losses against major world currencies.
With that, Cardano displayed strength that was last seen in mid-July when the “Ethereum-killer’s” token went on to climb 32%.
If the current momentum is sustained, Cardano’s price may climb higher, with the first obstacle emerging from the 50-day simple moving average (SMA) at $0.42. Additional roadblocks may arise from the $0.45 psychological level, the 100-day SMA sitting at $0.4611, and the $0.50 barrier.
Beyond that, ADA may rise to tag the optimistic target of the prevailing chart pattern around $0.5203. Such a move would represent a 29% ascent from the current price.

The rising relative strength index (RSI) supported Cardano’s optimistic outlook. Its position at 55 in the positive region suggested that the bulls were slowly taking over the price action and were determined to increase the price.
Also validating the bullish forecast for ADA was the upward movement of the moving average convergence divergence (MACD) indicator, which indicated that the market sentiment had flipped positive. In addition, the MACD sent a call to buy ADA on Monday when the 12-day exponential moving average (EMA) (blue line) crossed above the 26-day EMA (orange), marking the start of an uptrend.
On the downside, a daily candlestick close below the immediate support at $0.40 would signal weakness among the bulls, with the following line of defense emerging from the $0.372 support level. Further downward, ADA may be below the $0.36 support level embraced by the upper boundary of the descending channel.
Such a move would pull the asset back into the confines of the falling channel with the possibility of dropping to tag $0.35 psychological level. Traders could expect Cardano to consolidate here before staging a comeback.


