- Cardano’s ($ADA) price has plunged 35% in the past week, but the MVRV ratio suggests it may have reached a bottom.
- Both the RSI and MFI indicators have entered oversold territory, hinting at a potential bullish reversal if support at $0.56 holds.
- Analysts predict that ADA could rebound toward $0.94–$1.11, though a fall below $0.56 may lead to further declines toward $0.32.
The crypto market has turned harsh on Cardano ($ADA), with its price nosediving by 35% in the past seven days. Hawkish market conditions have rattled altcoins across the board, but for seasoned investors, this sharp decline might just be the opportunity they’ve been waiting for. Several key indicators suggest ADA could be bottoming out, paving the way for a potential rebound.
MVRV Ratio Signals ADA May Have Hit Bottom
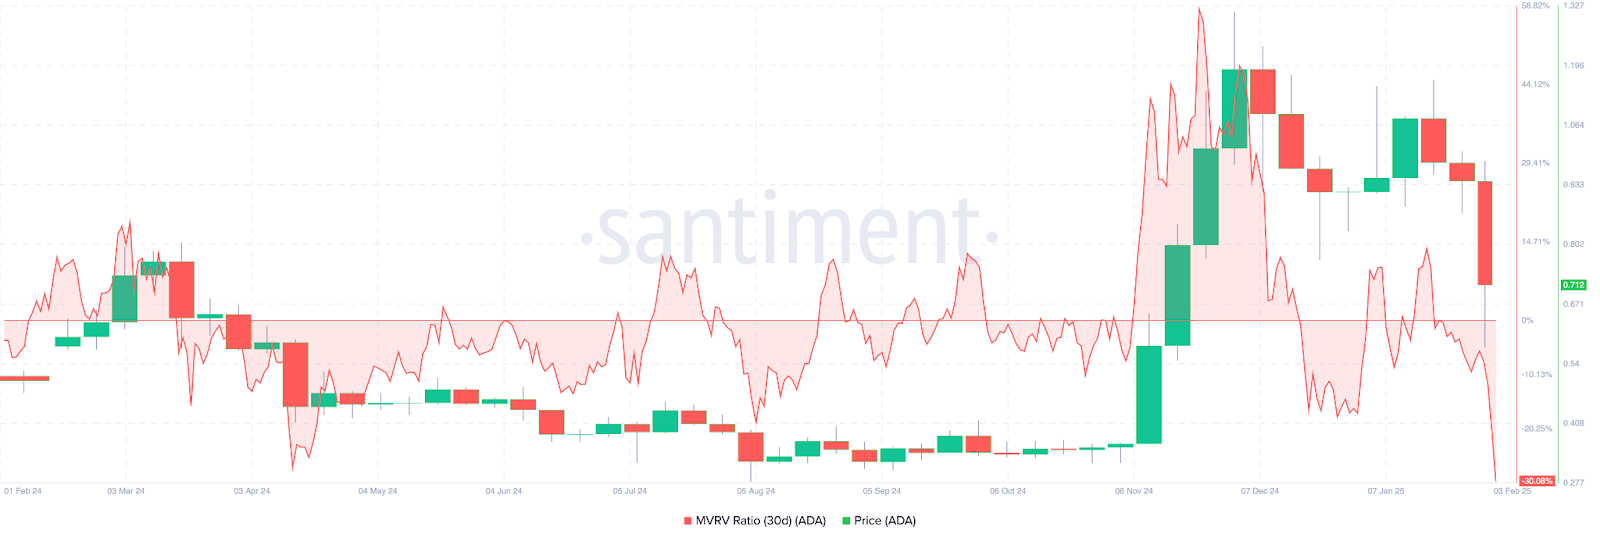
One of the most telling signs that Cardano may have reached its floor is the Market Value to Realized Value (MVRV)ratio. This metric gauges whether a crypto asset is undervalued or overvalued based on holders’ unrealized profits or losses.
A high MVRV ratio often indicates that many investors have unrealized profits, which can trigger selling pressure. Conversely, a low MVRV ratio suggests holders are sitting on losses and are less inclined to sell, reducing downward pressure.
Recent data from Santiment shows Cardano’s 30-day MVRV ratio has plunged to -30.08%. Historically, ADA tends to bottom out when the ratio falls between -27.15% and -5.85%. For example, in October 2024, when the ratio hit -10%, ADA was priced at $0.51. By December, the token had surged to $1.19.
If history repeats itself, ADA may be poised for another rally soon, with current conditions closely resembling previous recovery patterns.
Technical Indicators Point to Potential Reversal
On the technical front, ADA’s sharp correction can be traced to a rounding top pattern, which formed between Jan. 25 and Feb. 2 on the 4-hour chart. This pattern often signals the end of a bullish trend and a transition to a downtrend. Once ADA broke below the neckline at $0.87, the price swiftly dropped to $0.70.
However, signs of a recovery are emerging. Both the Relative Strength Index (RSI) and Money Flow Index (MFI)have dipped into oversold territory—RSI below 30 and MFI under 20. Now, these indicators appear to be climbing back, hinting that selling pressure may be easing.
ADA Finds Support Amid Volatility
The daily chart shows ADA resting near the 0.236 Fibonacci retracement level at $0.56, a crucial support zone. Additionally, the Average Directional Index (ADX)—which measures trend strength—has not hit a higher reading, suggesting that the bearish momentum may be weakening.
If ADA can maintain this support and the ADX reading continues to decline, the token could rebound toward the 0.618 Fibonacci level at $0.94. In a highly bullish scenario, analysts predict ADA might surge as high as $1.11.
That said, the key level to watch is $0.56. A breakdown below this threshold could push ADA down to $0.32, sparking fears of a prolonged bear cycle.
Final Thoughts: Is ADA Primed for a Comeback?
With both on-chain and technical indicators showing signs of stabilization, Cardano may be preparing for a rebound. The MVRV ratio suggests undervaluation, while oversold technical indicators hint at a potential bullish reversal. However, market volatility remains high, and traders will need to monitor critical support levels to confirm whether the worst is truly over.
As always, caution is key, but for those willing to take the risk, ADA might soon offer a rewarding entry point.