- Bitcoin’s price dropped by 5% on the daily chart for the first time since August 27th, falling below $23,000 from a high of $25,600.
- The correction can be attributed to rising funding rates and overleveraged positions in the futures market, which eventually tipped the scale in favor of the bears.
- From a technical standpoint, Bitcoin could potentially retest the liquidity zone around its psychological level at $20,000 or a deeper correction down to $19,000.
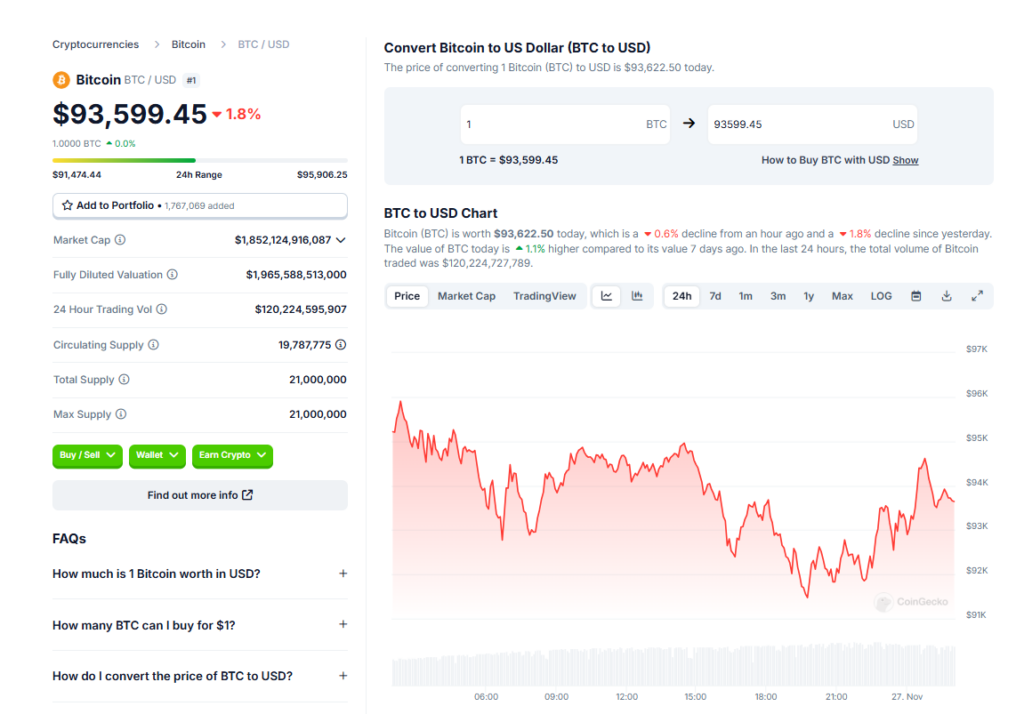
Bitcoin’s price has dropped by 5% on the daily chart for the first time since Aug 27, falling below $93,000 from a high of $99,600. This correction comes after Bitcoin reached an overbought status, with high leverage use in the market.
Bitcoin Reaches Overbought Levels
Bitcoin’s daily chart illustrated a strong bearish divergence between price and the relative strength index (RSI) before the correction, preventing the crypto asset from reaching the $100,000 price target.
Data from CryptoQuant highlighted that Bitcoin’s daily relative profit/loss (PL) ratio reached a high level, matching its all-time high value from March 2021. High Bitcoin PL ratios are often witnessed near market tops, with the metric reaching its peak when BTC registered its previous high of around $73,400 in Q1 2021.
While high PL ratios indicate profit-taking from long-term holders, it also leads to capital rotation where the selling pressure is absorbed by new retail investors during bull markets.
Overleveraged Futures Market
Bitcoin’s price fell prey to an overextended market evident across all time frames over the past few days. While price and market indicators highlighted bearish divergence, the futures market displayed overleveraged positions over the past week.
IntoTheBlock conveyed that Bitcoin’s correction can be attributed to rising funding rates which eventually tipped the scale in bears’ favor. However, further leveraged flushes should be limited with funding rates dropping to the normalized range.
What’s Next for Bitcoin?
From a technical standpoint, Bitcoin could potentially retest the liquidity zone around its psychological level at $90,000 or a deeper correction down to $85,000.

Bitcoin’s price rise from Nov 6 to Nov 22 was without any price inefficiency, which means there was no imbalance between buyers and sellers. In such cases, liquidity zones are the key areas of interest for BTC traders.
With the relative strength index (RSI) dropping below 50 for the first time since Nov 6, sellers are expected to dominate price action over the next week, which may lead to prolonged consolidation under the $95,000 mark. An immediate bullish confirmation would be a daily candle close above $95,000 but it looks less likely at the moment.


