- XRP’s weekly chart still holds a bullish higher low at $1.61, but momentum is turning bearish fast.
- A daily close below $2.06 or a 4-hour close below $1.97 confirms a deeper downtrend.
- Next supports sit at $1.9 and $1.61 if XRP fails to defend the $2 region.
XRP has been stuck in a retracement phase, dropping another 19% since October 27th — and late buyers are feeling most of the pain. A falling NVT ratio signals the asset is undervalued compared to its on-chain activity, but honestly that hasn’t helped sentiment much. Bears still have control of short-term momentum, and the charts across weekly, daily, and 4-hour timeframes are all telling slightly different stories… none of them fully comfortable for bulls right now.
Weekly Chart: Still Bullish, But Losing Strength
On the weekly timeframe, XRP’s swing structure is technically still bullish. The key higher low at $1.61 is holding — and that’s the level bears must crack to flip the long-term trend downward. But there’s pressure building.
The 78.6% Fibonacci retracement at $2.28 has already been lost, which is usually the final line of defense before deeper corrections unfold. RSI has slipped under neutral 50, showing momentum now favors the downside. OBV hasn’t collapsed, which helps the bull case a tiny bit, but it’s not enough to shift the overall tone.
XRP’s weekly outlook basically says: still structurally bullish… but hanging on by fingertips.
Daily Chart: $2.06 Is the Line Between Hope and Breakdown
Zooming into the 1-day chart, the structure is clearly bearish. The $2.7 region formed a heavy supply zone after the October crash left an imbalance behind — and that area has repeatedly rejected XRP on every attempt to reclaim it.
The key swing level right now is $2.06. A daily close below it confirms the next leg down. Above it, bulls still have a sliver of room to fight, though it’s narrowing quickly.
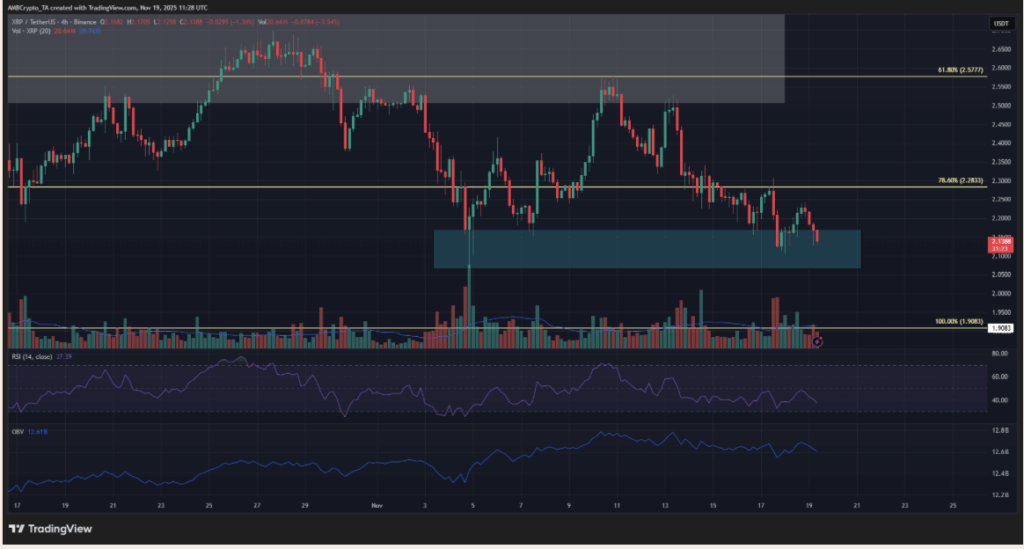
4-Hour Chart: Bulls Must Defend $2.06–$2.15 or Risk a Full Breakdown
On the 4-hour chart, things tighten even more. The zone between $2.06 and $2.15 is acting as a defensive wall for bulls — a sort of bullish fortress. XRP needs to bounce from here to keep a recovery even remotely possible.
There’s also a clear liquidity pocket between $1.97 and $2.01. For traders looking to go long, that’s a region where stop-losses fit neatly below $1.97. But if a 4-hour candle closes under $1.97, or a daily candle closes under $2.06, the downtrend is officially confirmed.
At that point, the next supports sit at $1.90 and then $1.61 — and bears will have full control again.
What Comes Next for XRP?
If XRP loses the $2 zone in the coming days, a fresh wave of selling could kick in fast, dragging price toward $1.9 and then possibly $1.61 — the critical higher low from the weekly chart.
Hold above $2, though, and XRP buyers may be able to breathe for a moment while the market attempts a mid-trend bounce.