
- XRP opened 2026 with a strong rally, but short-term momentum is beginning to fade
- A bearish RSI divergence suggests a pause or pullback could develop near current levels
- Analysts see a controlled correction, with key support around $2.05–$2.10
XRP kicked off 2026 with a strong burst of energy, rallying roughly 15% and pushing to a fresh local high above $2.15. The move caught plenty of attention, especially after weeks of tighter trading. Still, not everything under the hood looks perfectly aligned. Short-term technicals are starting to hint that the rally may be losing some steam.
On the hourly chart, a bearish divergence has formed on the Relative Strength Index. In simple terms, price keeps nudging higher, but momentum isn’t following with the same intensity. That kind of mismatch doesn’t stop trends on its own, but it often signals that buyers are getting a little tired.
Bearish Divergence Signals a Potential Pause
A bearish divergence shows up when price prints higher highs while the RSI slips into lower highs. That’s exactly what’s happening here. Buyers are still in control, but their strength appears to be fading compared to earlier in the move.
Notably, XRP’s RSI has struggled to reclaim the overbought zone with the same force seen during the initial breakout. Historically, this type of divergence tends to show up before short-term pullbacks or periods of consolidation. As a result, analysts are watching the $2.05 to $2.10 zone closely. A successful hold there could keep the broader structure intact, while a break might open the door to a deeper reset.
Analyst Expects a Reset, Not a Collapse
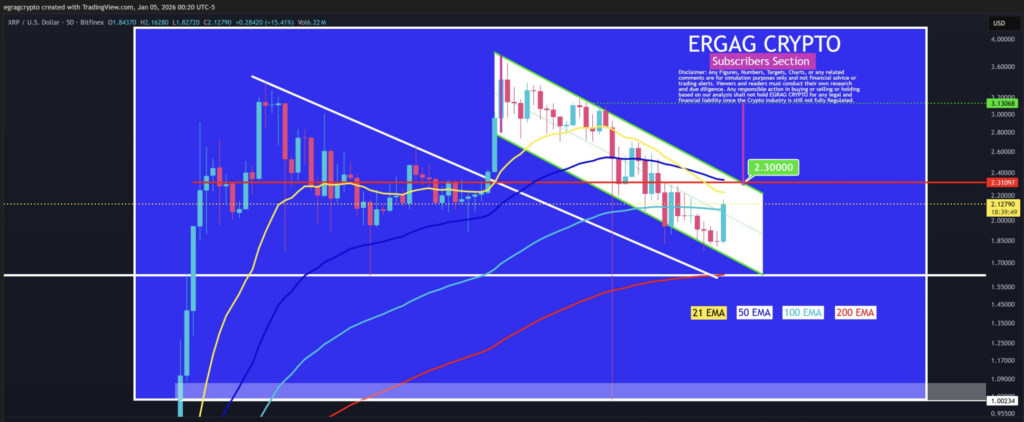
Crypto analyst EGRAG CRYPTO weighed in, suggesting that what XRP is experiencing now looks more like a controlled cooldown than a breakdown. On the 5-day chart, price is moving within a descending channel, a structure that typically reflects momentum cooling rather than aggressive selling.
EGRAG outlined clear levels to watch. A close above the 21 EMA, followed by a successful retest as support, would be a strong signal. From there, a break above the channel top near $2.30 could set the stage for a larger move toward the $3.10 to $3.30 range. According to his estimates, there’s roughly a 60% chance of an upside breakout, a 30% chance of continued range-bound action, and only a 10% probability of a full breakdown toward $1. As he put it, structure comes first, emotions later.
Key Support Zones Take Center Stage
With momentum softening, short-term support is now the main focus. The $2.05–$2.10 region stands out as a critical test. Holding above that range would help restore confidence among bulls and suggest the pullback is simply part of the trend’s natural rhythm.
For now, the RSI continues to trend lower while price remains elevated, pointing toward a possible pause rather than immediate continuation. Many traders are likely to stay patient here, waiting for confirmation before making their next move.