
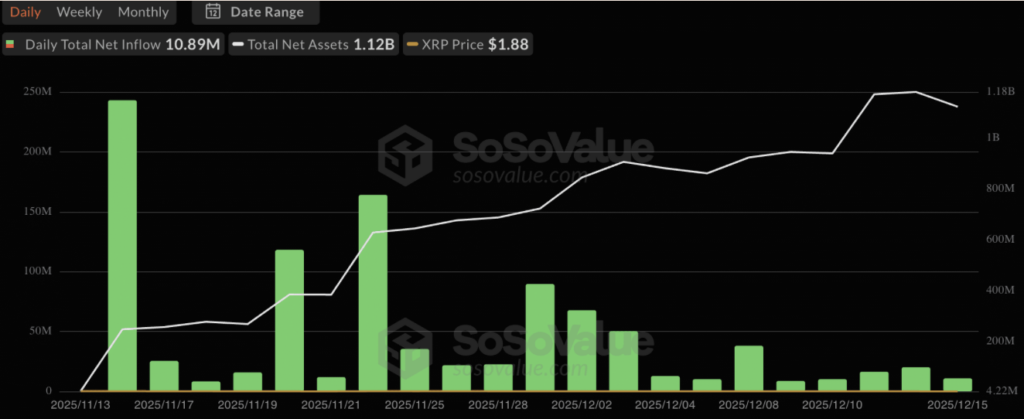
- XRP ETFs continue to see steady inflows, pushing total assets above $1.12B despite falling spot prices
- Price remains in a downtrend, but momentum indicators suggest bearish pressure is starting to fade
- Ongoing institutional accumulation could eventually place upward pressure on XRP’s spot market
XRP has logged another day of positive ETF inflows, quietly extending a streak that started not long after the product went live. According to fresh data from SoSoValue, about $10.89 million flowed into the XRP ETF today, lifting total net assets to roughly $1.12 billion. What makes this interesting is the timing. XRP’s spot price is still trending lower, yet institutional money keeps showing up.
That gap between steady ETF demand and a weakening price chart is starting to raise eyebrows. It naturally leads to one question. Are institutions slowly building positions while the broader market looks the other way?
Institutional Accumulation Shows No Signs of Slowing
Looking at the SoSoValue data, the pattern is hard to ignore. Since mid-November, inflow bars have stayed consistently green. ETF assets under management have climbed methodically past the $1.1 billion mark, and there haven’t been any meaningful outflow days since launch.
Even during bouts of wider market volatility, buyers kept allocating. That kind of persistence usually suggests longer-term positioning rather than short-term trading. Institutions may be treating current XRP prices as discounted entries, especially compared to earlier highs.
If this behavior continues, the ETF could start acting as a stabilizing layer for XRP’s market structure. Bitcoin ETFs showed a similar dynamic early on, absorbing supply during weak price periods before momentum eventually shifted.
XRP Price Weakness May Be Losing Steam
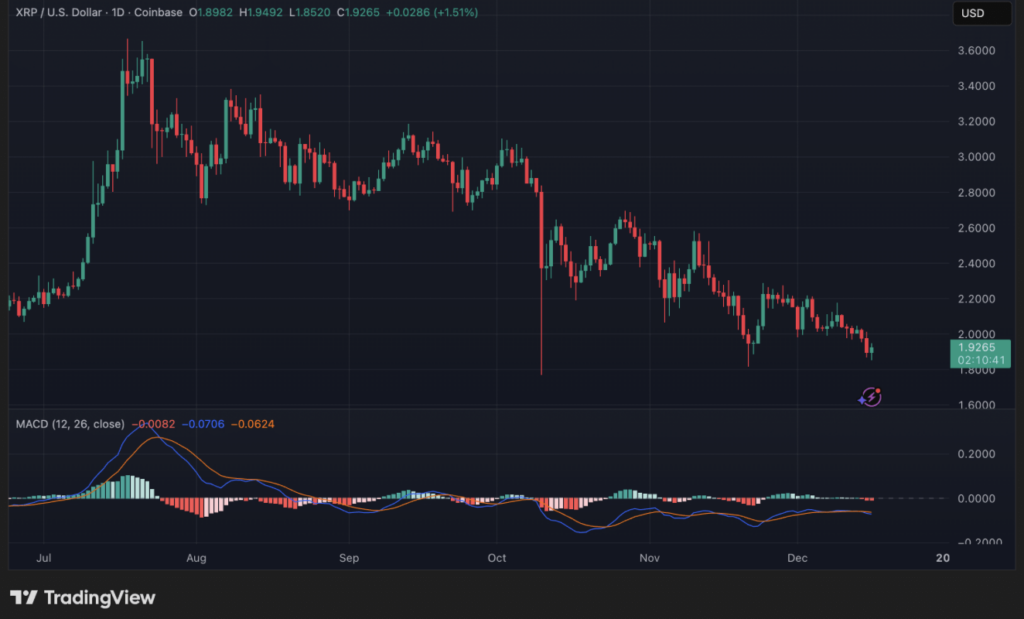
On the price side, XRP is still under pressure, no sugarcoating that. It’s trading near $1.92, more than 40% below its yearly peak, and the broader downtrend from early November is still intact. Daily charts continue to show lower highs and lower lows, which keeps sellers technically in control.
That said, momentum indicators are starting to tell a slightly different story. The MACD histogram has begun to flatten, and the MACD and signal lines are drifting closer together. This kind of compression often shows up when bearish momentum starts to fade, even if price hasn’t turned yet.
In other words, sellers are still active, but they may be running out of force. That’s a subtle shift, but an important one.
ETFs Buying While Retail Sells Feels Familiar
This setup isn’t new to crypto. In past cycles, periods where ETFs accumulated heavily during price weakness often lined up with late-stage retail selling. Institutions step in quietly, while sentiment on the ground remains pessimistic.
XRP’s current structure fits that pattern pretty well. Funds are buying into weakness rather than exiting. Retail sentiment remains soft. Momentum indicators are stabilizing instead of accelerating lower.
None of that guarantees an immediate bounce, of course. But historically, when ETF flows and price action diverge for long enough, price tends to play catch-up later.
Levels That Matter From Here
For now, a few areas stand out. Support near $1.85 is critical. Losing that could expose the $1.70 zone fairly quickly. On the upside, reclaiming $2.05 would be an early sign that trend strength is returning.
On the ETF side, daily inflows consistently pushing above the $15 million range could act as a trigger for stronger directional moves. Until then, XRP remains in a waiting phase, with institutions quietly accumulating and the market deciding when to notice.