- XRP’s multi-year Elliott Wave structure shows accumulation, not disorder
- Wave (5) projections point to long-term targets between $15 and $22
- Short-term corrections remain critical for validating the broader bullish setup
XRP has been tracing out a surprisingly clean technical structure over the past decade, one that doesn’t really show up unless you step back and look at the full picture. The broader cycle began forming somewhere between 2014 and 2016, and since then, price action has followed a multi-year rhythm that looks far more deliberate than chaotic.
XRP’s Long Cycle Shows Structure, Not Random Price Swings
Analysts using Elliott Wave theory point out that XRP has consistently printed higher lows and well-defined absorption zones, rather than sharp, emotional sell-offs. The first major advance, labeled Wave (1), was followed by a lengthy corrective phase. That Wave (2) wasn’t dramatic, it was slow, sideways, and honestly a bit boring. But that’s kind of the point.
This extended consolidation soaked up selling pressure over several years and built a base that didn’t collapse under stress. Instead of holders exiting, the structure suggests accumulation was quietly taking place. Long-term participants stayed put, even as momentum disappeared from the chart.
Wave (3) Changed the Market Structure
Recent chart behavior suggests that Wave (3) marked the most powerful phase of this cycle. XRP managed to push through key resistance levels, flipping market structure in the process. What followed wasn’t a breakdown, but a controlled pullback, commonly identified as Wave (4).
Price has remained above critical support levels like the 21 EMA, while continuing to form higher lows. That kind of behavior usually signals health, not weakness. According to analysts, this type of correction is normal before a final advance, and it hints that XRP may be setting up for a much larger move, rather than rolling over.
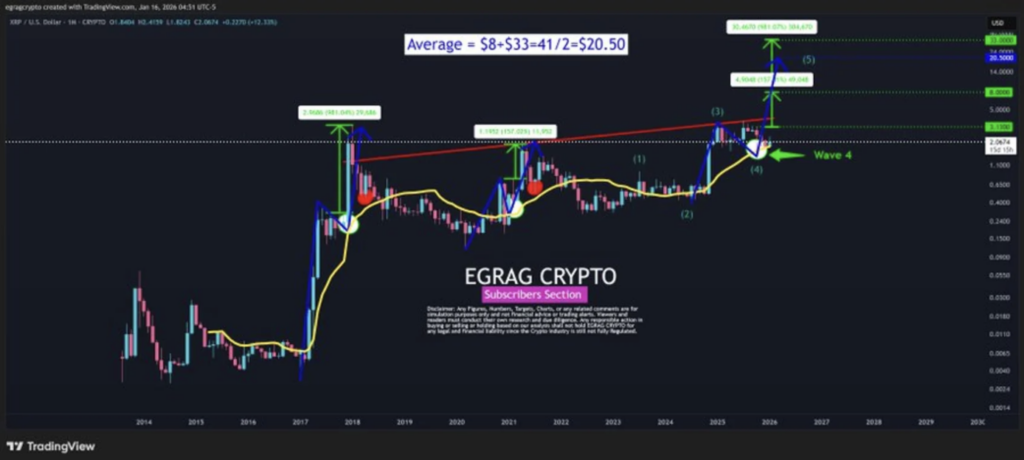
Wave (5) Could Define XRP’s Next Expansion Phase
If the structure continues to hold, Wave (5) could be the phase that drives XRP’s next major price expansion. Technical projections place potential targets between $15 and $22, with an average estimate near $20.50. These levels aren’t arbitrary. They’re derived from Fibonacci extensions and measured moves based on XRP’s prior cycles.
Charts also show a familiar rhythm forming. Momentum slows near support, stabilizes, and then resumes higher with strength. Analysts believe a strong Wave (5) would likely pull in broader market participation, pushing XRP closer to its long-term valuation potential. This isn’t blind optimism either. If XRP loses key support or breaks its upward trend, the bullish thesis weakens quickly. For now though, the structure remains intact.
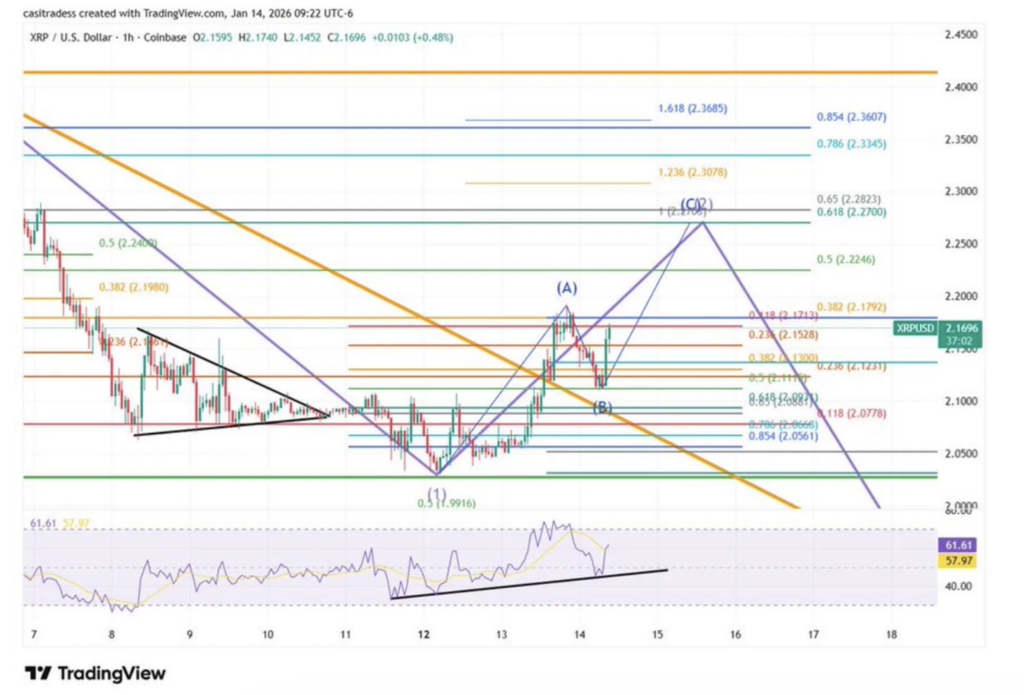
Short-Term Corrections Still Matter
While the long-term outlook looks constructive, short-term price action can’t be ignored. The Wave (2) correction zone around $2.11 to $2.26 plays an important role in validating the larger pattern. A rejection near $2.26 would align with expectations, while a clean breakout above $2.41 could invalidate the current Wave (2) setup altogether.
If Wave (2) holds, XRP may eventually transition back into a broader bullish trend. Until then, short-term traders should stay cautious. The structure may be building something big, but timing still matters.