
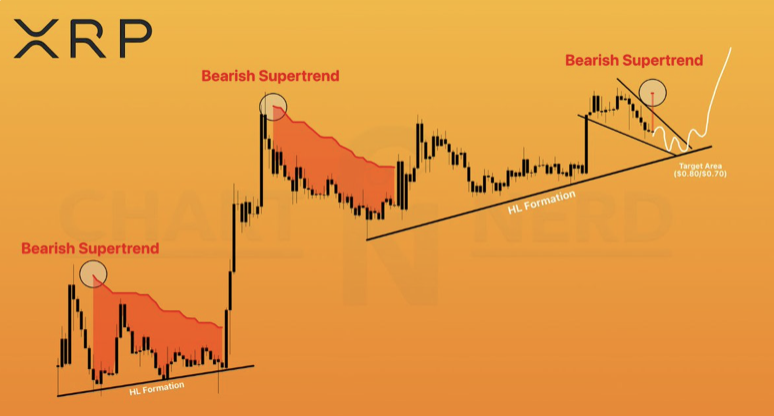
- XRP shows a rare bearish Supertrend signal with historical downside implications
- Weak momentum and derivatives data suggest growing selling pressure
- Key support zones around $0.80–$0.70 are being watched if the pattern holds
XRP is starting to look a bit uneasy again. A recent analysis from ChartNerd highlighted a rare Supertrend signal — something that’s only shown up twice before in XRP’s history. And both times… it didn’t exactly end well in the short term.
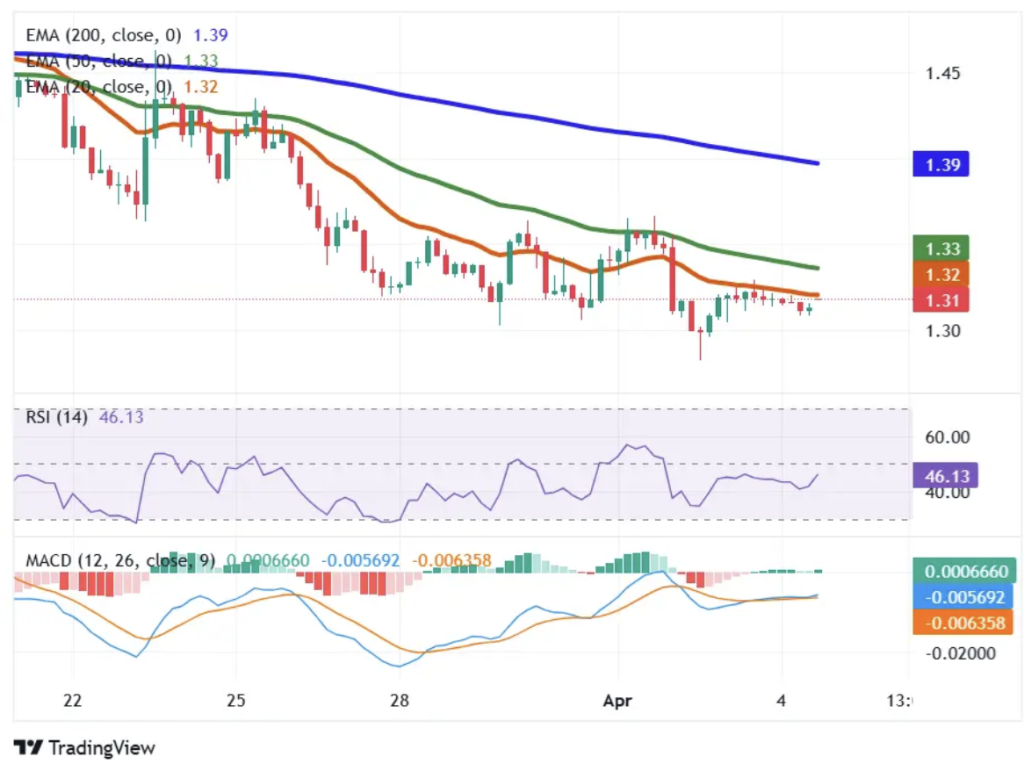
Right now, XRP is trading near $1.31, but momentum feels weak. Not collapsing, just fading slowly, which can sometimes be more concerning. These rare signals don’t guarantee anything, of course, but historically, they’ve pointed toward deeper pullbacks and retests of major support zones.
Technical Structure Leans Clearly Bearish
Looking at the chart, the weakness shows up across the board. XRP is trading below the 50 EMA and struggling to stay above the 20 EMA, which usually signals ongoing selling pressure.
Momentum isn’t helping much either. The RSI is sitting around 46 — not oversold, but definitely leaning weak. It leaves room for further downside, though at the same time, it’s not completely exhausted either… which means a bounce could still happen, just not a strong one.
MACD looks flat, almost indecisive. There’s no clear bullish crossover, no real sign of strength building underneath. Altogether, trend, momentum, and structure are all pointing in the same direction — and it’s not upward.
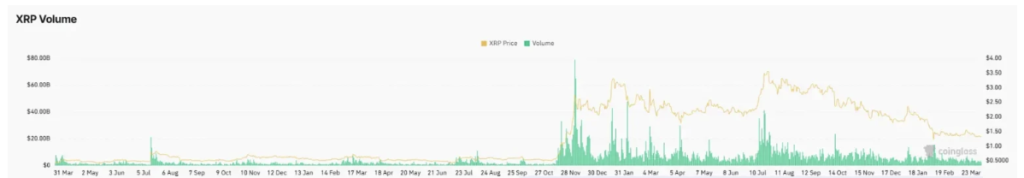
Derivatives Data Adds to the Caution
The derivatives side of things isn’t exactly encouraging either. Data from CoinGlass shows a drop in futures trading volume, which usually signals reduced participation. Less activity tends to weaken any bullish continuation attempts.
Open interest hasn’t changed much, but liquidation data tells a more interesting story. More long positions are getting wiped out compared to shorts, which often happens when traders expect a bounce… and don’t get it.
That kind of imbalance can create additional pressure. It’s the market’s way of resetting expectations, sometimes quite abruptly.
Historical Patterns Point Lower
What makes this setup more notable is how similar it looks to previous cycles. The last two times this Supertrend signal appeared, XRP ended up retracing back toward key support levels before eventually stabilizing.
If that pattern plays out again, price could drift toward the $0.80 to $0.70 range. It’s not a prediction set in stone, but it does line up with how XRP has behaved in past corrections.
Of course, there’s always an invalidation point. If XRP breaks above descending resistance and regains strength, the bearish outlook weakens quickly. But for now… that hasn’t happened.
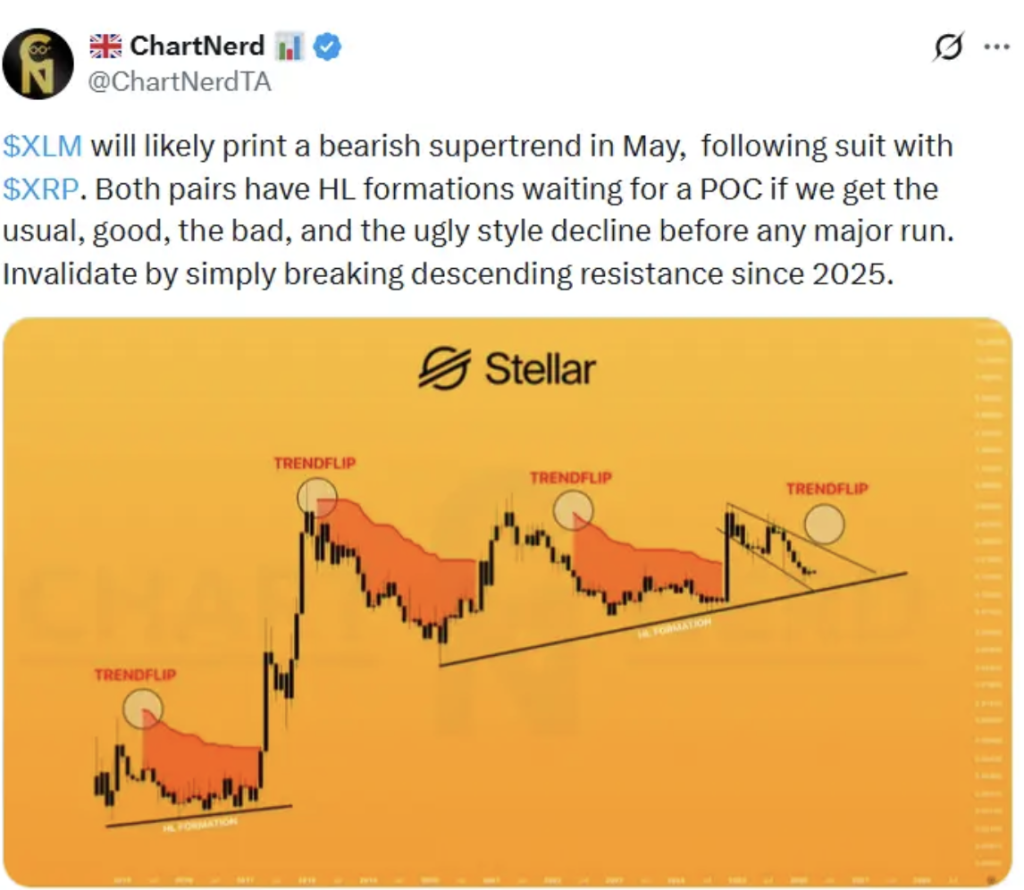
XLM Shows a Similar Setup
Interestingly, XRP isn’t alone here. Stellar (XLM) is showing a very similar structure on higher timeframes, according to ChartNerd. That kind of correlation tends to reinforce the broader outlook.
Both assets are maintaining higher low structures, but also showing signs of weakening momentum. If XLM follows through with a bearish flip — possibly around May 2026 — it could add further pressure to XRP as well.
Market Leans Bearish, But Not Final Yet
Right now, XRP sits in a fragile position. Technicals are leaning bearish, derivatives data shows caution, and historical patterns suggest a possible move lower.
But it’s not fully decided yet. Markets rarely move in straight lines, and even within bearish structures, there are bounces, pauses… moments that look like reversals but aren’t.
For now, traders are watching closely. Because if support starts to give, the next move could be sharper than expected.