
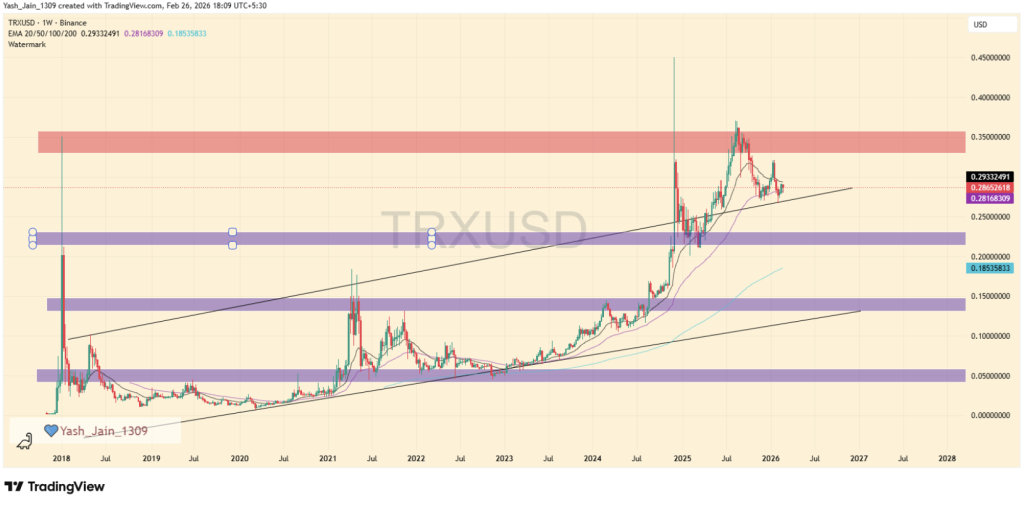
- TRX remains capped below the $0.33–$0.35 resistance zone, with repeated rejections signaling seller control.
- A breakdown below long-term channel support could open downside targets near $0.22 and potentially $0.13.
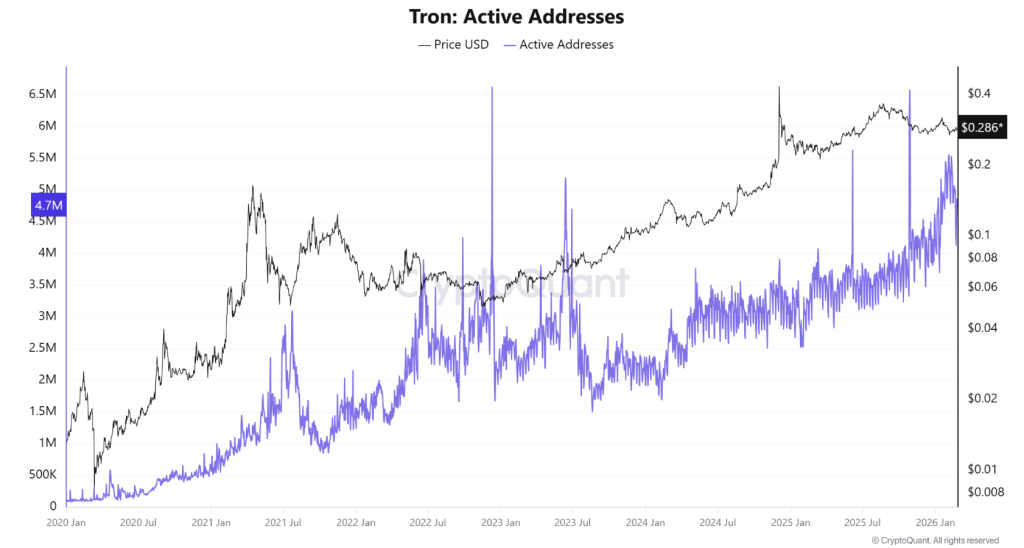
- Declining active addresses and stablecoin activity add pressure, making upcoming support levels critical.
TRX peaked at $0.3695 back in Q3 2025 — and that’s more or less where the music faded out. Since then, momentum hasn’t just cooled off, it’s stalled. The $0.3339 to $0.3500 range has quietly evolved into a stubborn ceiling, and every attempt to push through it has been slapped back down. Sellers didn’t rush in dramatically. They just… stayed.
That zone isn’t random clutter on the chart. It’s now a clear supply block. Rejections from it are stacking up, and with TRX hovering around $0.2864, price remains pinned beneath resistance it hasn’t been able to flip. When rallies consistently fail at the same level, that’s usually distribution — not strength.
And failed breakouts, historically, don’t end with fireworks.
The Channel That Won’t Go Away
Technically speaking, things get more delicate from here. In 2025, TRX broke out of a long-term ascending channel — a move that looked bullish at the time. Breakouts from multi-year structures often attract serious attention. But markets love irony. That old breakout level, the upper boundary of the channel, is now being retested as support.
If that support holds, structure remains intact. The breakout survives.
If it doesn’t? TRX slides back inside the channel it fought so hard to escape. And that’s where the downside math starts to sting. A confirmed breakdown opens the door to $0.2215. Lose that, and $0.1354 becomes the next logical magnet in a broader corrective phase. From current levels, that’s close to a 50% drop.
When traders talk about bearish TRX scenarios, this is what they mean. It’s not panic. It’s structure.
The Rally Wasn’t Just Hype
To be fair, the previous rally wasn’t empty speculation. It had fuel. A big driver was increased USDT activity on the Tron network. Stablecoin transfers surged, on-chain utility improved, and active addresses followed. That’s tangible growth.
In February, active addresses peaked around 5.60 million. They’ve since cooled to roughly 4.74 million. Not a collapse. More of a drift. And zoomed out, the multi-year uptrend in active addresses still holds. It’s been tested multiple times and hasn’t broken.
But here’s the thing about trendlines: the more they’re tested, the weaker they tend to become. Support isn’t infinite.
The 4 Million Line That Matters
Looking ahead into Q1 2026, another retest of that rising address trendline seems likely. If active addresses slip decisively — especially below the psychological 4 million mark — that would signal fading network engagement. And for a chain so closely tied to stablecoin activity, that matters.
Lower stablecoin transfers mean thinner liquidity. Thinner liquidity tends to amplify price moves. Usually downward, at least at first.
So what’s next for TRX? It all comes down to dual support. Price needs to hold the channel boundary. On-chain activity needs to stay resilient. If both crack, a correction toward $0.2215 — even $0.1354 — stops looking dramatic and starts looking probable.
Right now, TRX isn’t collapsing. It’s not in freefall. But it is standing on a trapdoor. And the hinges are starting to creak.