
- TRX is trading above $0.30 after successfully retesting a bullish breakout structure
- On-chain data and derivatives metrics show rising stablecoin activity and bullish positioning
- Technical indicators point to a potential move toward the $0.32 resistance level
Tron’s price has continued to grind higher, trading above the $0.30 level at the time of writing on Friday. Earlier this week, TRX briefly pulled back to retest a previously broken bullish structure, then bounced, a move that often signals strength rather than weakness. The recovery hasn’t happened in isolation either, on-chain and derivatives data are quietly lining up behind the move.
Price action suggests the market is still leaning higher. While nothing moves in a straight line, the structure now points toward a potential extension above recent highs, with levels north of $0.32 back in focus if momentum holds.
On-Chain and Derivatives Data Support the Upside Case
According to CryptoQuant’s aggregated metrics, activity across TRX spot and futures markets shows signs of accumulation. Large whale orders, cooling market conditions, and clear buy-side dominance are all present, a mix that has historically preceded short-term rallies rather than breakdowns. It’s not a guarantee, but the setup looks constructive.
Stablecoin data adds another layer. DefiLlama shows Tron’s total stablecoin supply has been climbing since late December, hitting a new record of $84.63 billion earlier this week before settling near $84.43 billion on Friday. Rising stablecoin supply typically points to increased network usage and liquidity, both of which tend to support price over time as more capital flows through the ecosystem.
Derivatives positioning also leans bullish. Coinglass data shows TRX’s long-to-short ratio sitting around 1.36, close to its highest level in more than a month. A ratio above one suggests traders are increasingly positioning for upside, even if some short-term volatility remains.
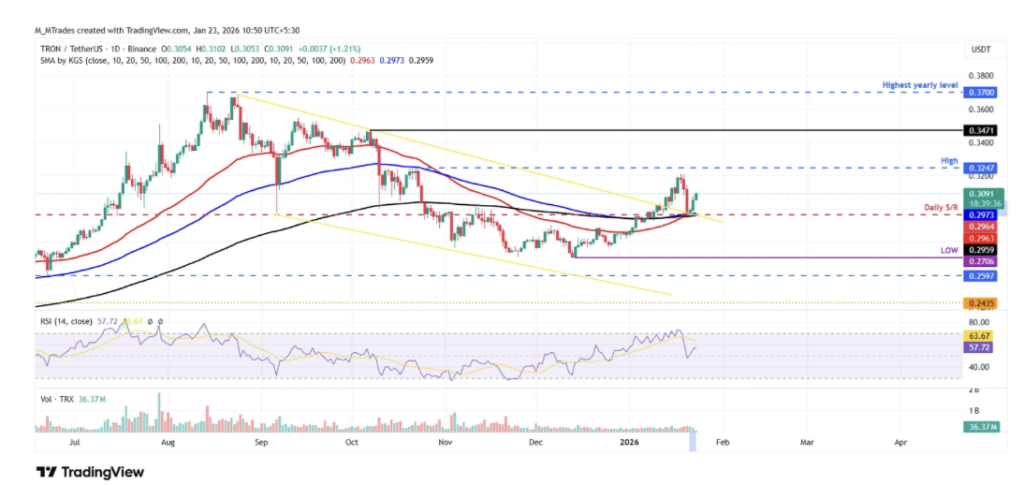
TRX Price Structure Points Toward $0.32
From a technical perspective, Tron’s recent move has been clean. TRX broke out of a falling wedge pattern on January 13, a structure that had been forming since late August, and gained nearly 5% in the days that followed. Some of those gains were given back earlier in the week, but the pullback stopped exactly where bulls would want it to.
On Wednesday, price retested the upper boundary of the former wedge and held. The rebound that followed pushed TRX higher by more than 3% the next day. This zone lines up with daily support near $0.29, along with the 50-day, 100-day, and 200-day moving averages, making it a key area of confluence and a clear reversal zone.
If the current trend continues, TRX could push toward the October 22 high near $0.32. Momentum indicators support that view for now. The daily RSI sits around 57, climbing above the neutral midpoint and signaling that bullish pressure is gradually strengthening. Still, if price slips back below $0.30, a retest of the $0.29 support wouldn’t be surprising, and that level remains critical for maintaining the broader bullish structure.