- Stellar fell nearly 10% to $0.1486 as a bearish head-and-shoulders pattern formed below $0.158.
- A daily close below $0.145 could open the door to a 28% decline toward $0.105.
- While derivatives traders lean heavily short, spot outflows suggest some long-term accumulation.
Rising tensions between the United States and Iran have rattled global markets, and crypto hasn’t been spared. Risk appetite thinned out almost instantly. In that environment, Stellar (XLM) is starting to look vulnerable.
Still, geopolitics isn’t the only force at work here. The chart itself has been quietly forming a bearish structure, and now that structure is starting to matter. On February 28, XLM dropped nearly 10% in just 24 hours, sliding to around $0.1486. Interestingly, trading volume jumped 17% to roughly $125 million during the sell-off. That’s not passive decline — that’s active repositioning.
Key Support Levels Come Into Focus
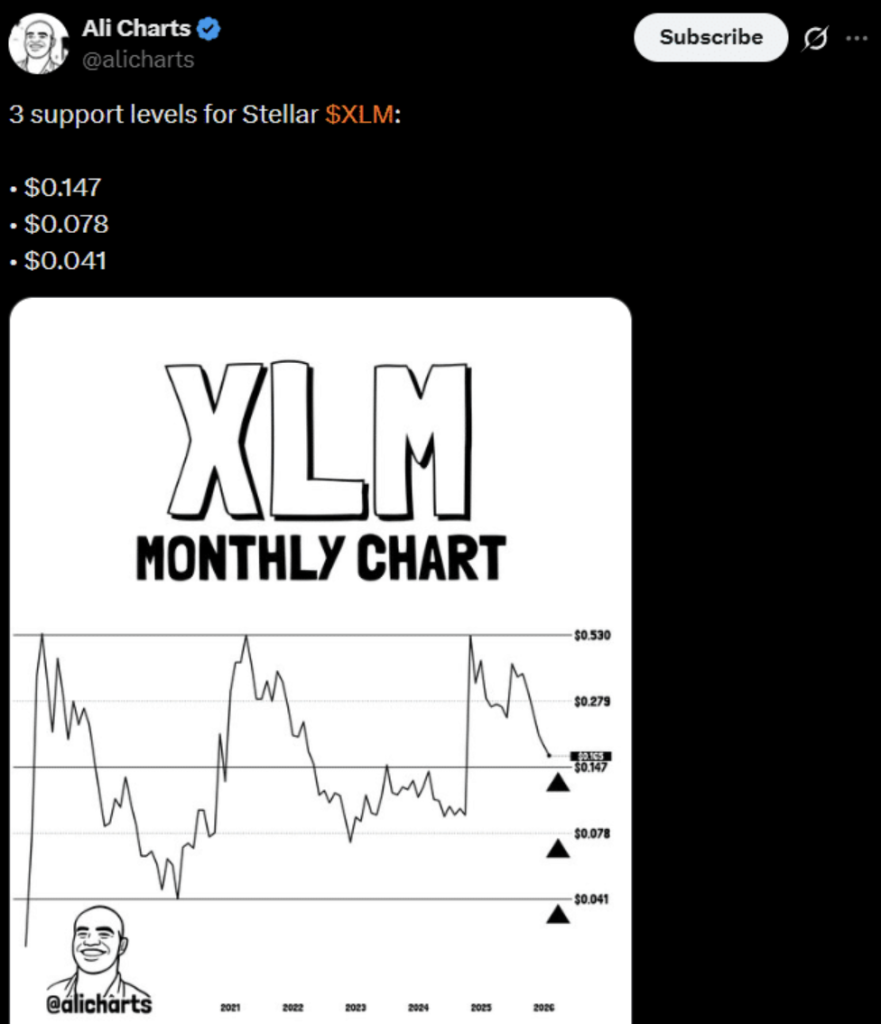
Crypto analyst Ali Martinez recently highlighted three levels that could define XLM’s path forward: $0.147, $0.078, and $0.041. The first of those is already being tested. When support levels start appearing in public analysis, they often become self-fulfilling battlegrounds.
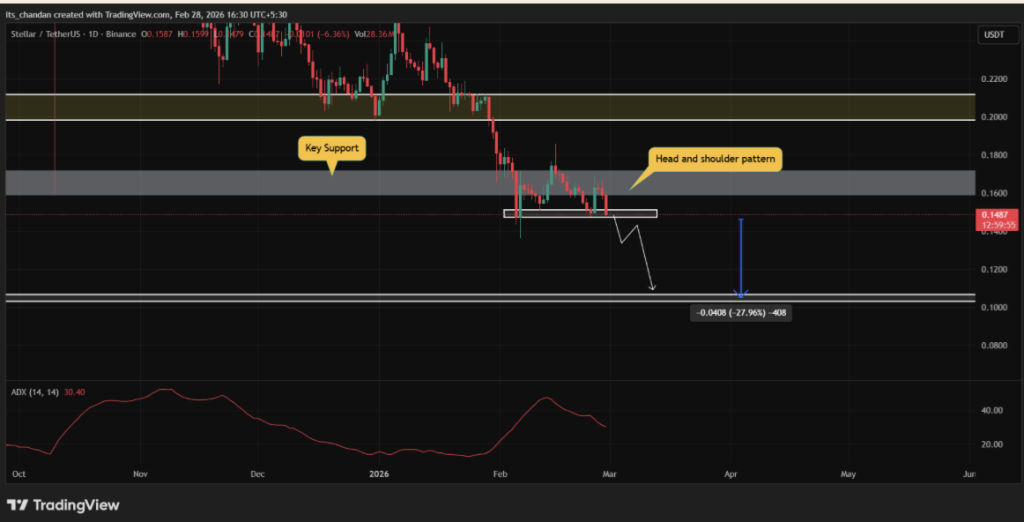
Looking at the daily chart, XLM appears to have formed a bearish head-and-shoulders pattern below the $0.158 region. That’s not a subtle formation. If price closes a daily candle below $0.145, the measured move from that pattern projects a potential 28% drop toward the $0.105 zone.
But here’s the nuance — the breakdown isn’t confirmed yet. Without a decisive close under $0.145, the bearish thesis remains conditional. Markets love invalidations as much as confirmations.
Momentum Is Building, Just Not Upward
The Average Directional Index currently sits above 30, clearing the key 25 threshold that signals strong trend momentum. That doesn’t tell you direction by itself. It just tells you something is gaining force.
Right now, that force leans bearish.
In derivatives markets, positioning reflects that caution. Data from Coinglass shows traders clustering leveraged positions around $0.149 as support and $0.1619 as resistance. Long positions total roughly $296,000 in leverage. Shorts? Nearly $1.5 million.
That imbalance is hard to ignore. It suggests most short-term participants expect XLM to struggle reclaiming higher levels anytime soon.
Spot Outflows Hint at Quiet Accumulation
Yet the picture isn’t entirely one-sided. Spot inflow and outflow metrics show around $319,000 worth of XLM leaving exchanges over the past 24 hours. That’s modest, but outflows typically suggest accumulation rather than distribution.
Long-term holders may be viewing this weakness differently from short-term traders. While leverage players press shorts, some investors appear to be quietly pulling coins into private wallets.
So what does it all mean? In the short term, momentum favors the bears. The chart structure, derivatives imbalance, and trend strength all lean downward. But if support stabilizes and accumulation continues under the surface, this volatility could eventually carve out a longer-term opportunity.
For now, XLM sits at a decision point. The next daily close might matter more than the headlines.