
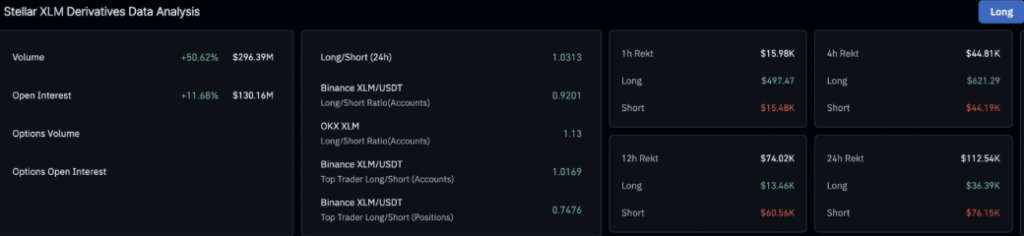
- Stellar is up over 7% around the $0.30 area, with futures open interest jumping ~11% and a long-to-short ratio above 1, hinting that traders are quietly leaning bullish again.
- Price is rebounding inside a descending channel but still trapped under the 50, 100, and 200-day EMAs; a break above these and toward the $0.37 channel top would be the first real sign of a stronger trend shift.
- Momentum is improving with a bullish MACD cross and RSI near 49, but the recent Death Cross keeps a bearish cloud overhead, and a drop below $0.2520 would confirm a fresh breakdown from the current structure.
Stellar (XLM) finally woke up a bit on Monday. The token edged higher by a little over 7% at press time, stretching its rebound inside a still-intact descending channel on the daily chart. Prices are curling up from the lower end of that pattern, which looks nice on the surface, but zoom out and you’ll see it’s still swimming against a broader downtrend.
Under the hood, derivatives data show that traders are slowly shifting back into risk-on mode. Open interest is climbing, long positions are edging ahead of shorts, and sentiment feels less “doom” and more “hmm, maybe there’s a bounce here.” Even so, XLM still has multiple layers of resistance hanging above it like a low ceiling, and any bullish trend shift will have to fight through those one by one.
Derivatives traders are quietly loading up on XLM
As the wider crypto market starts the week on a stronger footing — helped partly by optimism around a potential US government shutdown resolution — Stellar is pulling more interest from derivatives traders. CoinGlass data shows that XLM futures open interest has climbed to about $130.16 million, up roughly 11.68% in the last 24 hours. That’s a pretty solid jump and usually signals that traders expect more movement ahead, not less.
The long-to-short ratio is backing up this shift in tone. Over the past day, the ratio for XLM has moved to around 1.0597. Anything above 1 means there are more outstanding long positions than shorts, which basically translates to: traders are slightly more convinced about upside than downside right now. It’s not some crazy euphoric reading, but it does show a mild bullish lean rather than a fearful one.
So while the spot chart still looks like it’s recovering inside a bigger downtrend, the derivatives crowd seems to be quietly betting that this rebound has at least a bit more room to run.
Price recovers, but still trapped below key moving averages
On the spot side, Stellar is trading close to the $0.3000 mark as of Monday, bouncing from within that descending channel structure on the daily timeframe. The move higher is happening inside a larger bearish pattern, which is important — it’s a recovery leg, not yet a confirmed trend reversal.
Right now, XLM is still trading below three important Exponential Moving Averages:
- the 50-day EMA near $0.3265
- the 100-day EMA around $0.3417
- and the 200-day EMA close to $0.3361
Those levels are stacked above price like a staircase of resistance. If this recovery run can push through those average lines and hold above them, Stellar could start eyeing the upper boundary of the descending channel, which sits near the $0.3700 region. That overhead trendline would be the next big test for any serious bullish continuation.
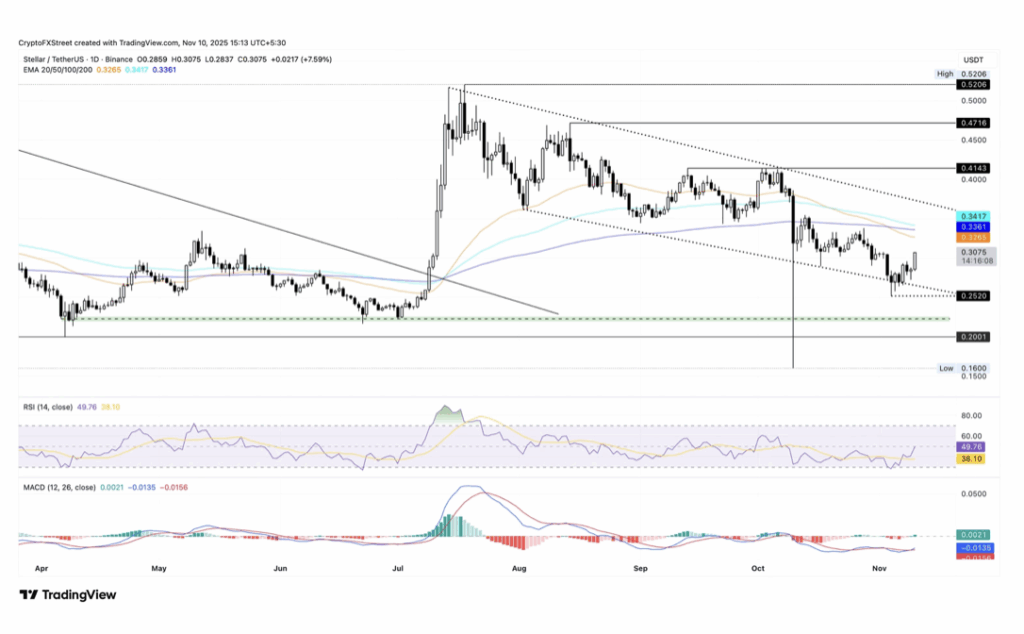
Momentum is improving, but the “Death Cross” still hangs over the chart
Technical indicators on the daily chart are starting to show a bit of life again. The MACD has crossed above its signal line, a classic sign that downside momentum is cooling and buyers are getting more active. At the same time, the RSI has climbed to about 49, creeping closer to the neutral 50 zone. That might sound boring, but it actually matters: it means selling pressure has eased off sharply, and the market is shifting back toward balance instead of being tilted heavily to the bears.
However — and this is a big “however” — the chart is still carrying the shadow of a recent Death Cross. On November 3, the 50-day EMA crossed below the 200-day EMA, which is generally seen as a medium-term bearish signal. It basically says, “yes, there’s a bounce, but the larger trend is still under bear control for now.” Until price can climb back above those higher EMAs and stay there, that Death Cross acts like a warning label stuck to the chart.
If this short-term recovery fizzles out, XLM could turn lower again and revisit last week’s low around $0.2520. A daily close below that level would confirm a bearish breakout from the falling channel and likely open the door to deeper downside. On the other hand, a strong rebound that clears those key moving averages and drives toward $0.3700 would go a long way toward proving that this is more than just another dead-cat bounce.
For now, Stellar sits in that awkward middle zone: stronger than it looked a few days ago, but still fighting against bigger, slower bearish forces hanging above it.