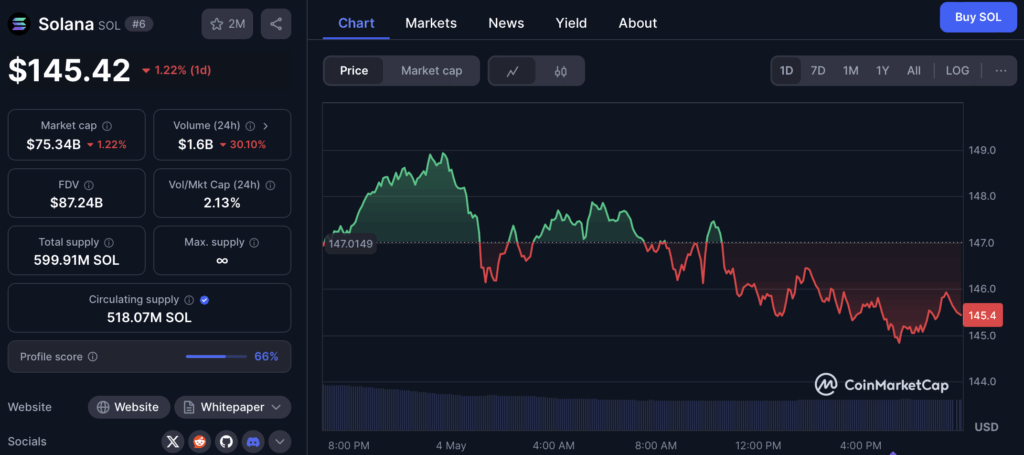
- Solana’s Struggles Continue: SOL is trading around $145, stuck below the 100-day moving average at $154. Technical indicators like the MACD and RSI show fading momentum, suggesting bulls are losing steam—for now.
- Traders Spot Bull Flag Formation: Some optimism remains as a classic bull flag pattern forms on the 4-hour chart. Traders believe a breakout could follow if SOL holds above key support between $144–$152.
- Eyes on $900, But It’s a Long Road: Analysts say breaking $170 and then $350 could set the stage for a rally to $900, mirroring a previous cycle from 2021. But for now, SOL needs to reclaim lost ground and break through resistance before bulls can celebrate.
After looking like it might take off in early April, Solana’s now limping into May with some heavy resistance dragging it down. It’s hanging out near $145 right now, and that pesky 100-day simple moving average at $154 is acting like a ceiling it just can’t break through. Bears have clearly taken the wheel—at least for the moment.
Momentum Slips, Buyers Back Off
Price action’s been choppy. And the indicators? Yeah, they’re not painting a great picture. The MACD’s flashing warning lights with a bearish crossover recently—that’s when the MACD line slips under the signal line, and those histogram bars start fading. Basically, bullish energy is cooling off. The RSI (Relative Strength Index) has also dipped from 60 to around 55. Not terrible, but definitely a sign that buyers are losing a bit of steam.
But Wait—There’s a Bull Flag?
Even with the weakness, some folks still have hope. One trader, Hardy, spotted a classic bull flag pattern forming on the 4-hour chart. That’s typically a bullish sign, for what it’s worth. SOL’s been consolidating in this tight descending channel between $152 and $144 after making a jump earlier. “I’m going to long this baby soon,” Hardy posted, betting on a breakout that could flip things around.
Resistance Ahead—But So Is Opportunity
If Solana does slide more, it’s got a few safety nets: support levels are sitting down at $136.56, $125.82, and worst case, $112.80. But really, everyone’s eyeing the upside. The next big obstacle? That would be around $170—the 1-week MA50, which also lines up with this key trend line. If SOL can punch through that, it could flip that level into strong support. And yeah, that opens the door to $200.
April Was Solid—Can May Deliver?
The crew at TradingShot pointed out that April actually gave SOL a bit of a lift. The token bounced off the 1-week MA200 and held on to some green candles through the month. That rally built some momentum, and now the question is—can May break that $170 ceiling?
If it does, next up is $350. According to TradingShot, that’s the “higher high” in a wedge pattern they’ve been tracking. And if—big if—it manages to push through $350 cleanly, we could be looking at the start of a serious rally. Like, $900 serious.
Aiming for $900… Eventually?
Let’s not kid ourselves, it’s a long road to $900. Solana’s already taken a 67% hit over the past three months, which, interestingly, mirrors its big correction from May 2021. That makes some analysts believe we’re just in another phase of a longer cycle.
“Given that the recent 3-month correction was -67.23%, identical to the last correction (May 2021), we expect one final rally to the 2.0 Fibonacci extension at $900—if the Higher Highs trend-line breaks,” TradingShot explained.
So yeah, that’s a pretty big “if,” and there are some serious technical levels that need to break before we even get close. First up, SOL needs to crack $170. Then it has to make it through $350. Only after clearing those hurdles can the $900 dream really come into play.
Right now, Solana’s still battling resistance and dragging a bit—but long-term bulls? They’ve got their eyes on that big prize.