
- Solana is trading near $79.89 after a 4% drop, testing a key horizontal support range.
- RSI is near oversold levels, but SOL remains below major moving averages and MACD stays negative.
- Holding support could trigger a bounce toward the top of the range, while a breakdown may accelerate downside pressure.
Solana is feeling the weight of the broader market right now. Selling pressure has intensified as SOL drifts toward a key support level, and for a moment it looked like that floor might give way. Yet buyers haven’t disappeared. They’re stepping in, cautiously, trying to defend the zone.
At the time of writing, SOL is trading around $79.89, down roughly 4.3% over the past 24 hours. Trading volume sits near $7.54 billion, and market capitalization hovers around $45.77 billion. Volatility remains elevated, and the mood across crypto isn’t exactly relaxed. Still, this level matters.
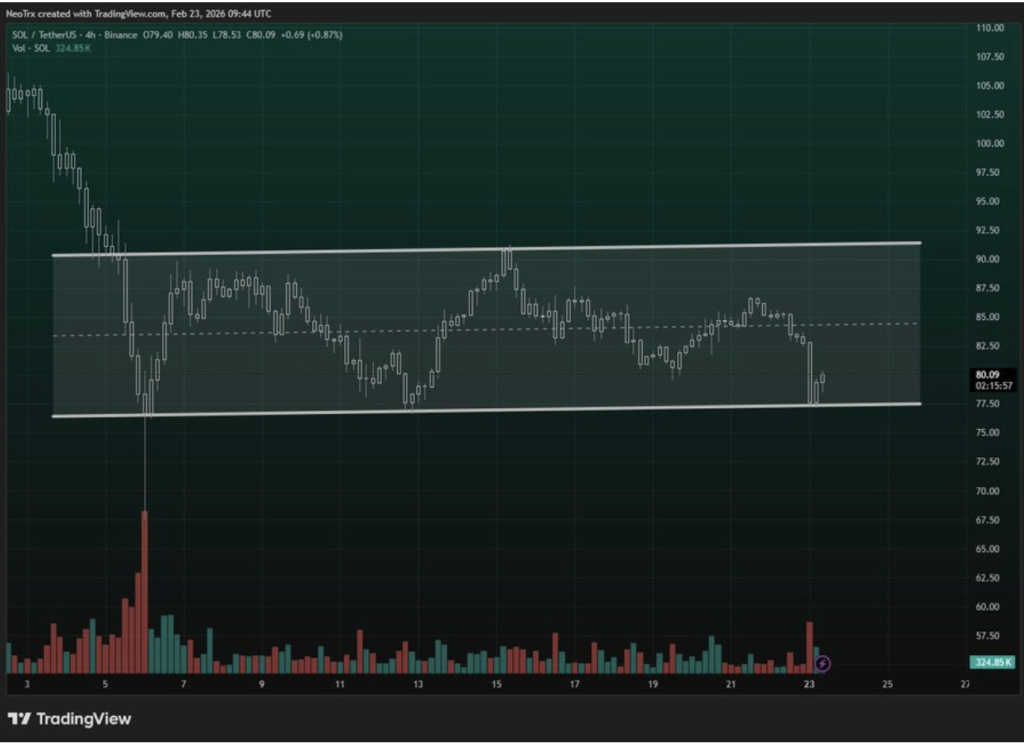
Range Structure Still Intact, For Now
On the 4-hour chart, Solana is moving inside a defined horizontal range. According to analyst Alpha Crypto Signal, price has recently bounced from the lower boundary of that range. It’s not a breakout. Not yet. But the structure hasn’t broken either.
As long as this support holds, the short-term outlook leans cautiously bullish. The logical target would be the upper end of the channel. That’s the technical roadmap traders are watching.
If the range breaks down decisively, though, that thesis flips quickly. Range trading works until it doesn’t. And in volatile environments, breakdowns can happen fast.
Indicators Show Oversold Conditions
Technically, the picture is mixed.
The Relative Strength Index sits at 28.62, below its signal line at 35.91. That places SOL near oversold territory. Oversold doesn’t automatically mean bounce, but it often signals that selling momentum may be stretched.
The Moving Average Ribbon tells a harsher story. SOL is trading well below its key averages: the 20 SMA near 131.05, the 50 SMA at 155.17, the 100 SMA at 163.28, and even the 200 SMA around 103.50. That’s a clear sign that the broader trend remains bearish.
MACD is also negative. The MACD line sits around -23.73, beneath the signal line at -17.97, with a negative histogram reading near -5.76. Momentum is still tilted toward sellers.
Caution Remains the Dominant Tone
So where does that leave Solana?
Short term, everything hinges on this support zone. If buyers continue defending it, a relief rally toward the top of the range becomes plausible. If it breaks, downside pressure could accelerate.
The setup isn’t screaming reversal. It’s whispering possibility. For now, SOL is caught between technical exhaustion and structural weakness. Traders will be watching closely, because the next move out of this range likely sets the tone for the coming weeks.