
- Solana is holding above $140 after a clean rebound from key support
- Spot SOL ETFs saw their strongest weekly inflows since mid-December
- Technical momentum remains bullish, with $160 acting as the next major resistance
Solana is starting to look steadier again. After bouncing from a key support area earlier in the week, SOL pushed back above $140 on Friday, extending its recent gains. The rebound didn’t happen in isolation either, institutional interest continues to quietly build, and that’s showing up in ETF flows.
On the technical side, the structure still favors the bulls. Momentum hasn’t broken, dips are getting bought, and the next major levels sit well above current price. As long as that dynamic holds, upside targets remain in play.
Institutional Demand for SOL Keeps Growing
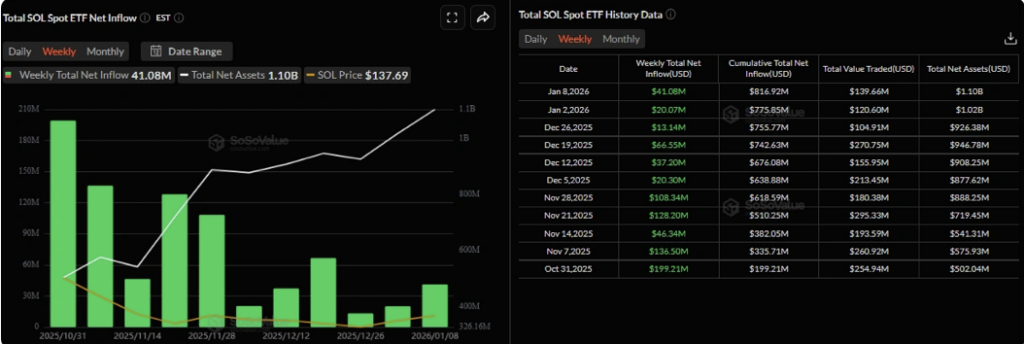
Flows into Solana spot ETFs picked up noticeably this week. Data from SoSoValue shows net inflows of roughly $41 million through Thursday, marking the strongest weekly intake since mid-December. That also extends a streak of weekly inflows going back to the ETFs’ launch in late October, which is worth noting.
Total net assets across these products have now climbed to around $1.10 billion. That doesn’t guarantee price appreciation on its own, but sustained inflows like this tend to create a supportive backdrop. If institutional demand keeps showing up, SOL may find it easier to grind higher rather than stall out.
More Signals That Confidence Is Building
There are a few other developments adding to the optimistic tone. Earlier this week, Morgan Stanley filed S-1 registration statements with the SEC for spot Bitcoin and Solana ETFs. While approval is never immediate, the filing alone signals growing interest from traditional finance players who are increasingly comfortable with Solana as an investable asset.
At the same time, the Wyoming Stable Token Commission launched the Frontier Stable Token, the first US state-issued stablecoin, directly on Solana. Moves like this don’t grab headlines the same way price spikes do, but they matter. They point to institutional trust in Solana’s infrastructure, not just its token.
SOL Rebounds Cleanly From Key Support
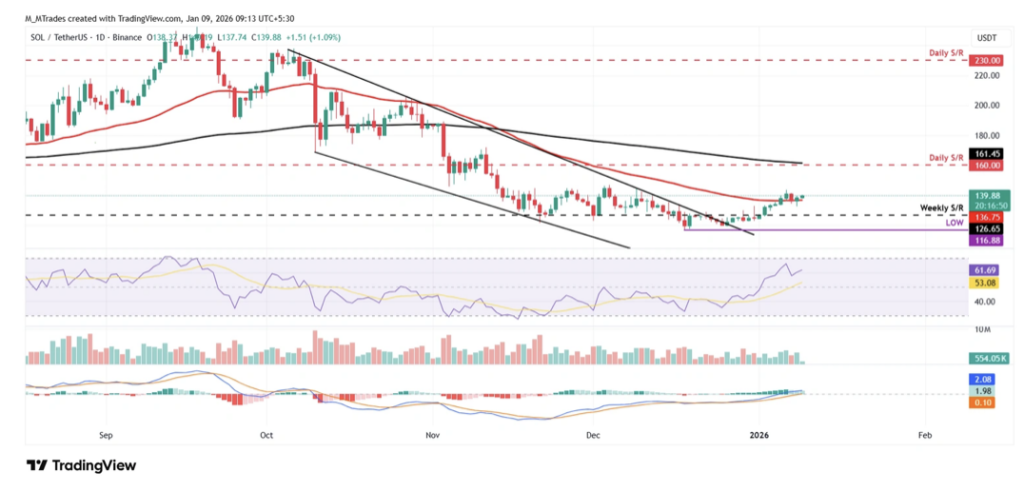
From a price action perspective, Solana has behaved well this month. SOL closed above the weekly resistance level near $126.65 on January 2, then rallied nearly 12% over the following five days. That move carried price above the 50-day EMA at roughly $136.75, an important technical marker.
There was a brief pullback on Tuesday that retested that moving average, but buyers stepped in quickly. By Friday, SOL was trading back above $139, suggesting the retest did its job. If momentum continues, the next major resistance level sits near $160, which becomes the obvious upside target.
Momentum Indicators Still Favor the Bulls
Indicators are largely confirming the move. The daily RSI is hovering around 61, comfortably above neutral territory, which points to strengthening bullish momentum rather than exhaustion. The MACD is also flashing positive signals, with a bullish crossover and expanding green histogram bars above the zero line.
That said, no move is straight up forever. If SOL does correct, the 50-day EMA around $136.75 remains the key level to watch. Holding above it keeps the short-term trend intact. Losing it would likely slow things down, at least temporarily.