- Solana trades above $230 after a 9% weekly gain, with bulls eyeing the $296 high.
- Stablecoin market cap hit $15.11B and TVL neared record highs at $12.69B.
- Derivatives data and technicals confirm bullish sentiment, though $213 remains a key support if a pullback comes.
Solana started the week trading in the green, sitting above $230 after climbing nearly 9% over the past seven days. Investors seem to be warming up again, and the charts are showing it too. With stronger on-chain flows and bullish signs in derivatives markets, traders are already looking ahead toward the all-time high near $296. The momentum feels different this time—steady, but with plenty of energy building under the surface.
Stablecoin Growth and Rising TVL Boost Solana Network Strength
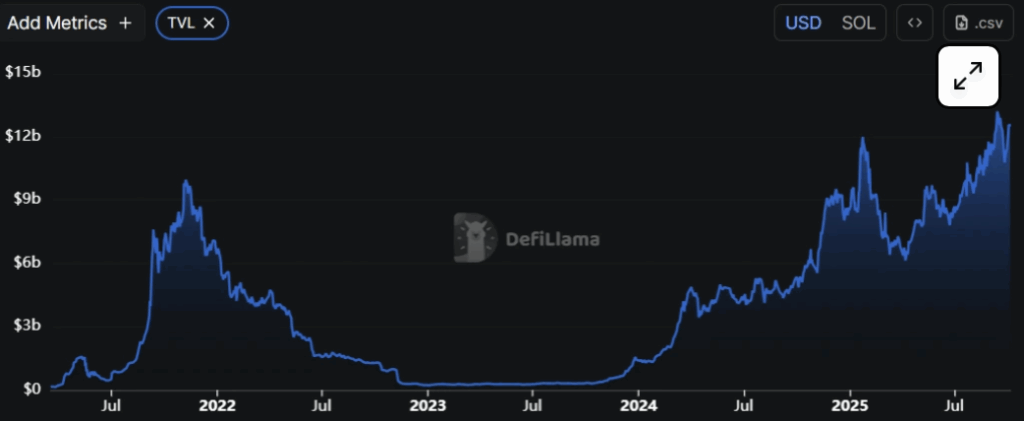
According to DeFiLlama, Solana’s stablecoin market cap has reached a fresh record of $15.11 billion, rising consistently since mid-September. This is a big deal since stablecoins often act as fuel for DeFi, payments, and even meme coin speculation, bringing more liquidity into the ecosystem. At the same time, Solana’s Total Value Locked (TVL) jumped from $10.78 billion at the end of September to $12.69 billion now—close to its all-time high of $13.02 billion. Rising TVL shows that more users are actively depositing and engaging with Solana-based protocols, a clear sign of growing trust in the network.
Derivatives Data Confirms Bullish Sentiment for SOL
Beyond on-chain growth, derivatives traders are leaning bullish too. CoinGlass data shows Solana’s funding rate flipped positive over the weekend, sitting at 0.0052% on Monday. That means long traders are paying shorts—an indicator often seen before sharp rallies. Historically, every time funding rates flipped like this, Solana’s price followed with strong upside moves. The long-to-short ratio is also at its highest in more than a month, another sign that traders are positioning for higher prices.
Solana Price Prediction: Key Support at $230, Next Target $296
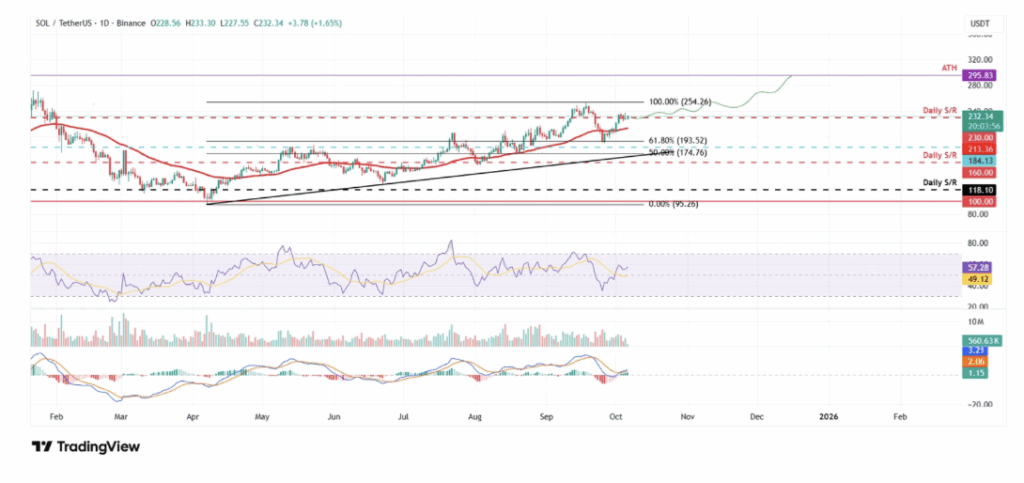
Technically, Solana has bounced hard since holding support around the 61.8% Fibonacci retracement at $193.52 in late September. The price has since gained nearly 18%, trading now near $232. If support at $230 holds firm, analysts see a path toward retesting the all-time high of $295.83. Momentum indicators back up the case: the RSI is at 57, signaling bullish energy without being overbought, while the MACD shows a recent bullish crossover with rising histogram bars. On the flip side, if a correction sets in, Solana could dip back toward the 50-day EMA at $213. For now, though, the bulls look to be firmly in control.