- Solana is trading above $137 after gaining more than 7% over the past week, supported by steady price action rather than sharp spikes.
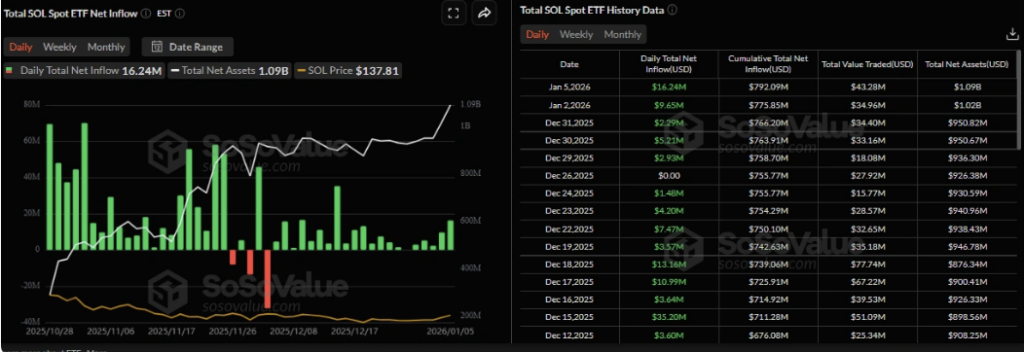
- Spot Solana ETFs recorded over $16 million in daily inflows, pushing total assets above $1 billion and signaling rising institutional interest.
- Bullish on-chain data and improving technical indicators suggest SOL could target $150, though support near $126 remains key if momentum fades.
Solana is stepping into the new year with noticeable strength. At the time of writing on Tuesday, SOL was trading above the $137 level, holding onto gains after rising more than 7% over the past week. The move has come alongside improving sentiment across the broader market, but Solana appears to be benefiting from its own set of tailwinds as well.
Price action has remained relatively steady rather than euphoric, which many traders see as a healthier setup. Instead of sharp spikes, SOL has been grinding higher, suggesting demand is building rather than fading quickly.
Institutional Demand Quietly Accelerates
One of the biggest drivers behind Solana’s recent strength is renewed institutional interest. Data from SoSoValue shows that spot Solana ETFs recorded roughly $16.24 million in net inflows on Monday, marking the strongest single-day inflow since mid-December.
That push lifted total net assets in Solana ETFs above the $1 billion mark this week. While one day doesn’t define a trend, continued inflows at this pace would signal that institutions are increasingly comfortable allocating capital to SOL, not just trading it short term.
On-Chain Metrics Support a Bullish Bias
On-chain data is also leaning constructive. CryptoQuant’s summary metrics point to buy-side dominance across both spot and futures markets, with large whale orders appearing alongside cooler market conditions. In simple terms, accumulation looks more intentional than reactive.
Meanwhile, DefiLlama data shows Solana’s stablecoin supply recovering steadily since early January, now sitting around $15.32 billion. Rising stablecoin balances often hint at growing on-chain activity, as capital waits to be deployed into DeFi, trading, or other applications within the ecosystem.
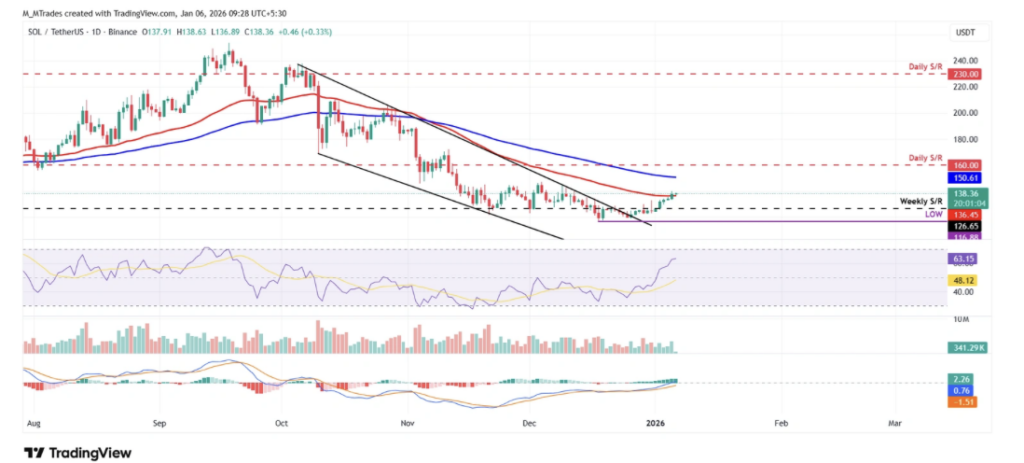
Technical Structure Sets Sights on $150
From a chart perspective, SOL has already cleared an important hurdle. Price broke above the upper trendline of a falling wedge pattern on December 26 and rallied more than 12% through Monday. That move also pushed Solana above its 50-day EMA, a level that had previously acted as resistance.
If momentum holds, the next technical target sits near $150, close to the 100-day EMA. The RSI currently reads around 63, above neutral but not overheated, while the MACD continues to print rising green histogram bars. Together, those indicators suggest bullish momentum is building, though not yet stretched.
Downside Risks Still Linger
Despite the improving setup, downside scenarios can’t be ignored. A broader market pullback or a loss of momentum could send SOL back toward its weekly support near $126.65. How price behaves in that zone would likely determine whether this move is a pause or something more meaningful.
For now, Solana’s blend of ETF inflows, supportive on-chain data, and improving technicals keeps the short-term outlook tilted bullish, even if volatility makes a brief return.